According to the Crime Statistics Agency (CSA) Victoria, Lyndhurst crime rate for the year ending June 2022 was 4586 incidents per 100,000 population. This represents a 2% decrease from the previous year.
Lyndhurst Crime Index
52
(100 is safest)
Safer than 52% of most Australia suburbs
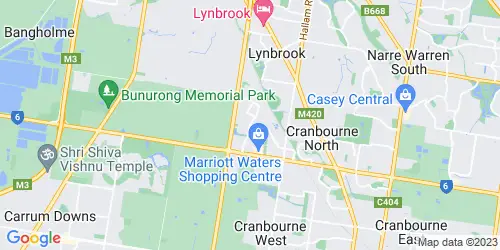
Lyndhurst Crime Map
Is Lyndhurst Safe?
Lyndhurst has moderate safety metrics. Crime rates in Lyndhurst are about average for most suburbs and neighborhoods in Australia. Lyndhurst is safer than 52% of all Australian suburbs and than 42% of Victoria suburbs. However, steal from a motor vehicle is a common offence in Lyndhurst.
Lyndhurst Crime Statistics at a Glance
Has Crime in Lyndhurst increased or decreased in the past 5 years? The chart below shows the 60-month historical trend of the number of offences that occurred in Lyndhurst.
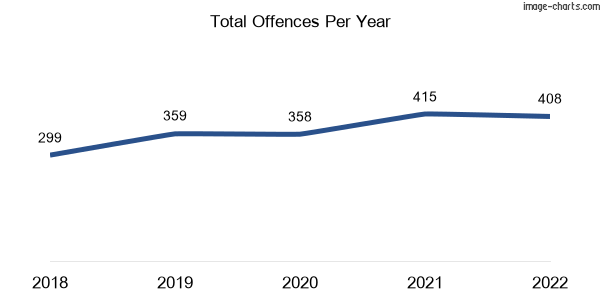
- The number of criminal incidents recorded by Victoria Police in the year 2022 was 408, down 2% from 415 incidents recorded in the same period last year.
- Lyndhurst is in the 42nd percentile for safety, meaning 58% of Victoria suburbs are safer than Lyndhurst and 42% of suburbs are more dangerous than Lyndhurst.
- Common crime: steal from a motor vehicle.
- The number of assault offences recorded in 2022 decreased by 8% (3 Incidents) compared to the previous year..
- The number of deception offences recorded in 2022 increased by 123% (16 Incidents) compared to the previous year.
- The number of burglary offences recorded in 2022 decreased by 33% (13 Incidents) compared to the previous year.
- There was no change in the number of theft offences recorded during the years 2021 and 2022.
- The number of robbery offences recorded in 2022 increased by 300% (3 Incidents) compared to the previous year.
- The number of motor vehicle thefts recorded in 2022 decreased by 39% (9 Incidents) compared to the previous year.
- The number of vandalism offences (Property damage) recorded in 2022 increased by 7% (1 Incidents) compared to the previous year.
Thinking of moving to Lyndhurst?
Experience the ease of moving with Muval, the ‘Uber for removals,’ backed by over 35,000 successful moves. Tap into Australia’s largest network of verified removalists nationwide. Compare prices & reviews, book, and move smoothly with Muval now!
Crime in Lyndhurst: An In-Depth Analysis
Based on the latest crime statistics from the Crime Statistics Agency (CSA) Victoria, AU Crime Rate’s analysis indicates that Lyndhurst (Vic.) is safer than only 52% of all suburbs across the nation, regardless of population size. This implies that Lyndhurst’s crime rate is about average for most suburbs and neighborhoods in Australia.
How does Lyndhurst perform compared to other suburbs of all population sizes in Victoria? The crime rate in Lyndhurst is greater than that of roughly 58% of other suburbs in Victoria, leading to moderate public safety scores.
As a resident of Lyndhurst, the likelihood of becoming a victim of crime is 1 in 30 based on the combined crime rate of offences against the person and property. This is in contrast to the Victoria average, where the chance of becoming a victim of crime is 1 in 19.
To get a more comprehensive understanding of Lyndhurst’s crime statistics, it is essential to take a closer look at its against the person and property crime data. This examination is particularly critical because it enables us to determine whether violent crime, property crime, or both are the primary contributors to the total crime rate in Lyndhurst. By doing so, we can gain a more in-depth insight into the nature and extent of crime in Lyndhurst.
AU Crime Rate’s analysis has uncovered that the rate of crimes against the person in Lyndhurst is 663 per one hundred thousand inhabitants. By contrast, the statewide average for such crimes stands at 1247. This suggests that experiencing serious offences like homicide, assault, robbery, dangerous and negligent acts endangering people, stalking, harassment and threatening behaviour is 1 in 150 if you reside in Lyndhurst.
Our data reveal that the odds of becoming a victim of property crime in Lyndhurst are 1 in 38, with a rate of 2585 incidents per 100,000 residents. Keep in mind that the Victoria average is 3580 incidents per 100,000 residents. The types of property crimes tracked in this analysis include theft, burglary, arson, deception, bribery and damage to property.
Want to understand criminal offences in Victoria and make sense of crime data? Our easy-to-understand crime glossary provides definitions for Victoria’s common criminal offences. Check it out and get the inside scoop on crime in Victoria!
Lyndhurst Crime Rates by Offences Division
| Division | Number of Crimes | Crime Rate (Per 100,000 Residents) |
|---|---|---|
| Crimes against the person | 59 | 663 |
| Property and deception offences | 230 | 2585 |
| Drug offences | 23 | 259 |
| Public order and security offences | 32 | 360 |
| Justice procedures offences | 55 | 618 |
| Other offences | 9 | 101 |
| Total | 408 | 4586 |
Lyndhurst Crimes Against the Person
These are violent crimes against people whether these are family violence or non-family violence. Basically, if someone does something to hurt or scare another person, it’s considered a crime against the person. This includes:
- Assault and related offences: There are different types of assault, like serious assault, which is when someone causes really serious injuries as a result of a physical attack, and assault on police, emergency services or other authorised officers, which is when someone attacks a cop or a paramedic or someone doing their job. There’s also common assault, which is like when someone threatens to punch you or makes you feel scared for your safety.
- Robbery: There are two types of robbery or mugging: aggravated and non-aggravated. Aggravated robbery is when someone uses a weapon like a knife or a firearm (armed robbery) or causes serious harm to the victim during the robbery, like hitting them with a bat or a gun. Non-aggravated robbery is when someone doesn’t use a weapon or cause serious harm during the robbery but still uses force or the threat of force to take something from the victim.
- Dangerous and negligent acts endangering people: These refer to behaviours or actions that put others at risk of harm or injury due to carelessness or recklessness. Examples of dangerous and negligent acts include driving under the influence of drugs or alcohol, not properly securing a load on a vehicle that could fall and cause an accident, leaving hazardous materials unattended, and failing to maintain a property in a safe condition.
- Stalking, harassment and threatening behaviour: This represents harassing or threatening someone based on their race, skin colour, ethnicity, gender, sexual orientation, religion, or disability, in what’s known as hate crimes. It also includes insulting someone, cyberbullying, and cyberstalking.
My Chances of Becoming a Victim of a Crime Against the Person
1 in 150
In Lyndhurst
1 in 78
In Victoria
Crimes Against the Person Comparison (Per 100,000 Residents)
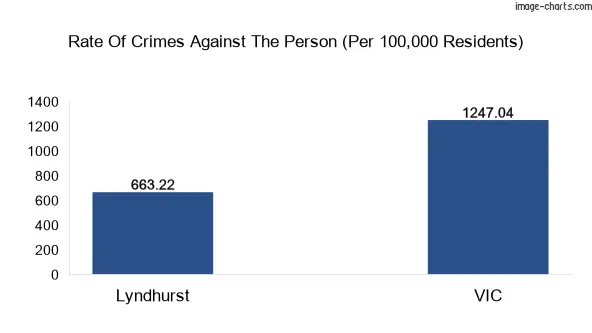
Crimes Against the Person: Lyndhurst vs Victoria
Lyndhurst population: 8896
Victoria population: 6503491
| Crimes | Total Criminal Incidents | VIC Total Criminal Incidents | Crime Rate (per 100,000 residents) | VIC Crime Rate (per 100,000 residents) |
|---|---|---|---|---|
| Assault and related offences | 37 | 45391 | 382 | 689 |
| Robbery | 4 | 2350 | 45 | 36 |
| Dangerous and negligent acts endangering people | 5 | 6293 | 56 | 96 |
| Stalking, harassment and threatening behaviour | 7 | 13324 | 79 | 202 |
It’s important to note that the crime rates for sexual offences and homicide are not included in the previously mentioned data for Lyndhurst. Here is Victoria’s total data for these offences can be used as a benchmark for comparison.
| Crimes | Victoria Total Criminal incidents | VIC Crime Rate (Per 100,000 residents) |
|---|---|---|
| Homicide and related offences | 198 | 3 |
| Sexual offences | 13576 | 206 |
Lyndhurst Property and Deception Offences
These are crimes related to stealing or damaging property or deceiving someone for personal gain. Property crimes include:
- Theft: It can be committed in various forms such as shoplifting, stealing from a person’s home, or taking a vehicle without permission. Other examples include stealing a bicycle, snatching a purse, or taking items from an unattended bag.
- Burglary (unlawful entry): Aggravated and non-aggravated burglaries are examples of burglary. Aggravated burglary involves the use of weapons, threats, or violence during the break-in, while non-aggravated burglary does not involve such factors.
- Arson: Arson is a criminal act of intentionally setting fire to a property, building, or forest (bushfire) without lawful or justifiable reason.
- Property damage: This refers to intentional or accidental harm caused to someone else’s property, such as vandalism, or graffiti.
- Deception: This is a broad category of offences that includes various examples. These include forgery and counterfeiting, deceptive business practices, professional malpractice and misrepresentation, and other similar offences. Additionally, it includes obtaining benefits by deception, possessing equipment to make a false instrument, and stating false information. All of these crimes involve intentionally deceiving others for personal gain or causing harm to others through fraudulent means.
- Bribery: Sneaky shortcut to get ahead by taking advantage of someone’s position or power.
My Chances of Becoming a Victim of Property and Deception Offences
1 in 38
In Lyndhurst
1 in 27
In Victoria
Property and Deception Offences Comparison (Per 100,000 Residents)
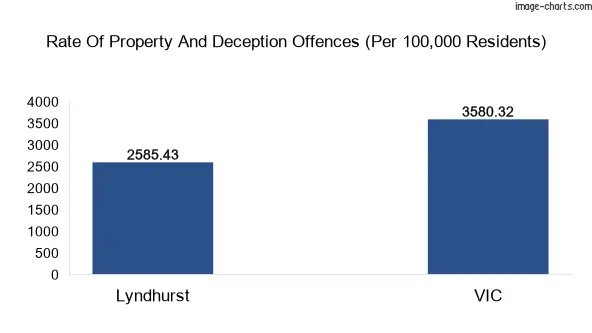
Property and Deception Offences: Lyndhurst vs Victoria, Australia
Lyndhurst population: 8896
Victoria population: 6503491
| Crimes | Total Criminal Incidents | VIC Total Criminal Incidents | Crime Rate (Per 100,000 Residents) | VIC Crime Rate (Per 100,000 Residents) |
|---|---|---|---|---|
| Property damage | 15 | 38352 | 169 | 582 |
| Burglary/Break and enter | 26 | 29621 | 292 | 449 |
| Theft | 160 | 138668 | 1799 | 2103 |
| Arson | 0 | 2124 | 0 | 32 |
| Deception | 29 | 27275 | 326 | 414 |
| Bribery | 0 | 3 | 0 | 0.05 |
Here is a breakdown of Lyndhurst crime rate and offences count for the major property and deception offences.
| Crimes | No. of offences | Rate |
|---|---|---|
| Motor vehicle theft | 14 | 157 |
| Steal from motor vehicle | 65 | 731 |
| Steal from retail store | 35 | 393 |
| Aggravated burglary | 8 | 90 |
| Non-aggravated burglary | 18 | 202 |
Drug Offences
Drug offences are illegal activities involving drugs like possession, trafficking, and manufacturing. It can involve both illicit and legal drugs like prescription medicines used improperly.
Drug Offences Comparison (Per 100,000 Residents)
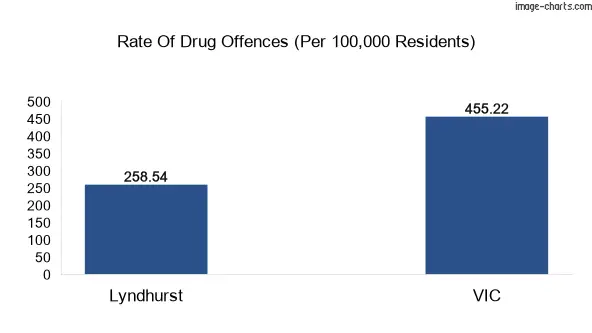
Drug Offences: Lyndhurst vs Victoria
| Crimes | Total Criminal Incidents | VIC Total Criminal Incidents | Crime Rate (Per 100,000 Residents) | VIC Crime Rate (Per 100,000 Residents) |
|---|---|---|---|---|
| Drug use and possession | 15 | 24069 | 169 | 365 |
| Drug dealing and trafficking | 6 | 3734 | 67 | 57 |
| Cultivate or manufacture drugs | 2 | 1716 | 22 | 26 |
| Other drug offences | 0 | 493 | 0 | 8 |
Public Order and Security Offences
Public order and security offences refer to crimes that threaten the safety and security of the community, such as disorderly conduct, possession of illegal weapons, public intoxication, and disturbing the peace. These offences can also include crimes that disrupt the functioning of society, like rioting, protesting without a permit, and obstructing traffic.
Public Order and Security Offences Comparison (Per 100,000 Residents)
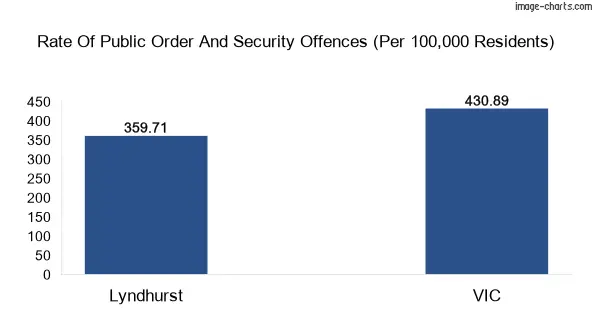
Public Order and Security Offences: Lyndhurst vs Victoria
| Crimes | Total Criminal Incidents | VIC Total Criminal Incidents | Crime Rate (Per 100,000 Residents) | VIC Crime Rate (Per 100,000 Residents) |
|---|---|---|---|---|
| Public nuisance offences | 2 | 3918 | 22 | 59 |
| Disorderly and offensive conduct | 2 | 9174 | 22 | 139 |
| Public security offences | 0 | 375 | 0 | 6 |
| Weapons and explosives offences | 28 | 14941 | 315 | 227 |
Lyndhurst Crimes per Square KM
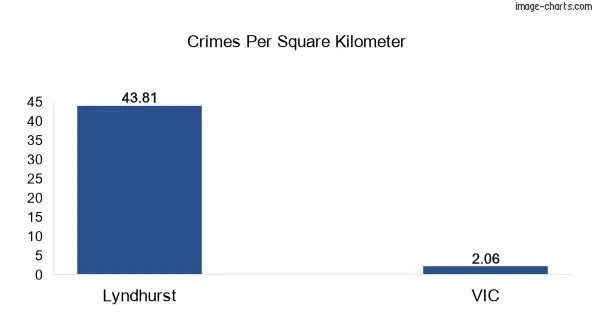
What’s the most common crime in Lyndhurst?
According to the latest available data from the Crime Statistics Agency of Victoria (CSA), the most common type of crime in Lyndhurst is steal from a motor vehicle.
What is the crime rate in Lyndhurst?
The overall crime rate in Lyndhurst, as measured by the number of reported offences per 100,000 population was 4586 in the year ending June 2022.
However, it’s important to note that this is an aggregate figure that includes all types of crime, and some types of offences are more prevalent than others. Additionally, crime rates can vary by location, with some areas experiencing higher rates of certain types of crime than others.
Is Lyndhurst a safe place to live in?
Lyndhurst is safer than 52% of suburbs across Australia and the crime rates are about average for most suburbs and neighborhoods in Australia. Compared to Victoria suburbs, Lyndhurst is safer than 42% of other suburbs in the state which are considered moderate safety scores in Victoria.
Total Crime Stats of Lyndhurst
| Offence Division | Offence Subdivision | Offence Group | Year (2021) | Year (2022) |
|---|---|---|---|---|
| A Crimes against the person | A20 Assault and related offences | Family violence serious assault | 6 | 2 |
| A Crimes against the person | A20 Assault and related offences | Non-Family violence serious assault | 2 | 7 |
| A Crimes against the person | A20 Assault and related offences | Family violence common assault | 24 | 19 |
| A Crimes against the person | A20 Assault and related offences | Non-family violence common assault | 5 | 6 |
| A Crimes against the person | A20 Assault and related offences | A22 Assault police, emergency services or other authorised officer | 0 | 0 |
| A Crimes against the person | A50 Robbery | A51 Aggravated robbery | 1 | 4 |
| A Crimes against the person | A50 Robbery | A52 Non-aggravated robbery | 0 | 0 |
| A Crimes against the person | A70 Stalking, harassment and threatening behaviour | Family violence stalking | 3 | 0 |
| A Crimes against the person | A70 Stalking, harassment and threatening behaviour | Non-Family violence stalking | 2 | 2 |
| A Crimes against the person | A70 Stalking, harassment and threatening behaviour | Family violence threatening behaviour | 7 | 4 |
| A Crimes against the person | A70 Stalking, harassment and threatening behaviour | Non-Family violence threatening behaviour | 2 | 0 |
| A Crimes against the person | A70 Stalking, harassment and threatening behaviour | Family violence harassment and private nuisance | 9 | 0 |
| A Crimes against the person | A70 Stalking, harassment and threatening behaviour | Non-Family harassment and private nuisance | 4 | 1 |
| A Crimes against the person | A80 Dangerous and negligent acts endangering people | A81 Dangerous driving | 3 | 1 |
| A Crimes against the person | A80 Dangerous and negligent acts endangering people | A82 Neglect or ill treatment of people | 0 | 0 |
| A Crimes against the person | A80 Dangerous and negligent acts endangering people | A83 Throw or discharge object endangering people | 1 | 2 |
| A Crimes against the person | A80 Dangerous and negligent acts endangering people | A89 Other dangerous or negligent acts endangering people | 5 | 2 |
| B Property and deception offences | B10 Arson | B11 Cause damage by fire | 1 | 0 |
| B Property and deception offences | B10 Arson | B12 Cause a bushfire | 0 | 0 |
| B Property and deception offences | B10 Arson | B19 Other fire related offences | 0 | 0 |
| B Property and deception offences | B20 Property damage | B21 Criminal damage | 14 | 14 |
| B Property and deception offences | B20 Property damage | B22 Graffiti | 0 | 0 |
| B Property and deception offences | B20 Property damage | B29 Other property damage offences | 0 | 1 |
| B Property and deception offences | B30 Burglary/Break and enter | B31 Aggravated burglary | n.a. | 8 |
| B Property and deception offences | B30 Burglary/Break and enter | B32 Non-aggravated burglary | n.a. | 18 |
| B Property and deception offences | B40 Theft | B41 Motor vehicle theft | 23 | 14 |
| B Property and deception offences | B40 Theft | B42 Steal from a motor vehicle | n.a. | 65 |
| B Property and deception offences | B40 Theft | B43 Steal from a retail store | 38 | 35 |
| B Property and deception offences | B40 Theft | B44 Theft of a bicycle | 1 | 2 |
| B Property and deception offences | B40 Theft | B45 Receiving or handling stolen goods | 7 | 22 |
| B Property and deception offences | B40 Theft | B46 Fare evasion | 0 | 0 |
| B Property and deception offences | B40 Theft | B49 Other theft | 12 | 22 |
| B Property and deception offences | B50 Deception | B51 Forgery and counterfeiting | 1 | 4 |
| B Property and deception offences | B50 Deception | B52 Possess equipment to make false instrument | 0 | 0 |
| B Property and deception offences | B50 Deception | B53 Obtain benefit by deception | 12 | 25 |
| B Property and deception offences | B50 Deception | B54 State false information | 0 | 0 |
| B Property and deception offences | B50 Deception | B55 Deceptive business practices | 0 | 0 |
| B Property and deception offences | B50 Deception | B56 Professional malpractice and misrepresentation | 0 | 0 |
| B Property and deception offences | B50 Deception | B59 Other deception offences | 0 | 0 |
| B Property and deception offences | B60 Bribery | B61 Bribery of officials | 0 | 0 |
| C Drug offences | C10 Drug dealing and trafficking | C11 Drug dealing | 0 | 0 |
| C Drug offences | C10 Drug dealing and trafficking | C12 Drug trafficking | 0 | 6 |
| C Drug offences | C20 Cultivate or manufacture drugs | C21 Cultivate drugs | 0 | 2 |
| C Drug offences | C20 Cultivate or manufacture drugs | C22 Manufacture drugs | 0 | 0 |
| C Drug offences | C20 Cultivate or manufacture drugs | C23 Possess drug manufacturing equipment or precursor | 1 | 0 |
| C Drug offences | C30 Drug use and possession | C31 Drug use | 0 | 0 |
| C Drug offences | C30 Drug use and possession | C32 Drug possession | 6 | 15 |
| C Drug offences | C90 Other drug offences | C99 Other drug offences | 0 | 0 |
| D Public order and security offences | D10 Weapons and explosives offences | D11 Firearms offences | 1 | 18 |
| D Public order and security offences | D10 Weapons and explosives offences | D12 Prohibited and controlled weapons offences | 3 | 10 |
| D Public order and security offences | D10 Weapons and explosives offences | D13 Explosives offences | 0 | 0 |
| D Public order and security offences | D20 Disorderly and offensive conduct | D21 Riot and affray | 0 | 0 |
| D Public order and security offences | D20 Disorderly and offensive conduct | D22 Drunk and disorderly in public | 1 | 0 |
| D Public order and security offences | D20 Disorderly and offensive conduct | D23 Offensive conduct | 0 | 2 |
| D Public order and security offences | D20 Disorderly and offensive conduct | D24 Offensive language | 1 | 0 |
| D Public order and security offences | D20 Disorderly and offensive conduct | D25 Criminal intent | 1 | 0 |
| D Public order and security offences | D20 Disorderly and offensive conduct | D26 Disorderly conduct | 0 | 0 |
| D Public order and security offences | D30 Public nuisance offences | D31 Privacy offences | 0 | 0 |
| D Public order and security offences | D30 Public nuisance offences | D32 Hoaxes | 0 | 0 |
| D Public order and security offences | D30 Public nuisance offences | D33 Begging | 0 | 0 |
| D Public order and security offences | D30 Public nuisance offences | D34 Defamation and libel | n.a. | 0 |
| D Public order and security offences | D30 Public nuisance offences | D35 Improper movement on public or private space | 1 | 2 |
| D Public order and security offences | D30 Public nuisance offences | D36 Other public nuisance offences | 0 | 0 |
| D Public order and security offences | D40 Public security offences | D41 Immigration offences | 0 | 0 |
| D Public order and security offences | D40 Public security offences | D43 Hacking | 0 | 0 |
| D Public order and security offences | D40 Public security offences | D44 Terrorism offences | 0 | 0 |
| D Public order and security offences | D40 Public security offences | D49 Other public security offences | 0 | 0 |
| E Justice procedures offences | E10 Justice procedures | E11 Escape custody | n.a. | 0 |
| E Justice procedures offences | E10 Justice procedures | E12 Fail to appear | 0 | 0 |
| E Justice procedures offences | E10 Justice procedures | E13 Resist or hinder officer | 9 | 10 |
| E Justice procedures offences | E10 Justice procedures | E14 Pervert the course of justice or commit perjury | 0 | 0 |
| E Justice procedures offences | E10 Justice procedures | E15 Prison regulation offences | 0 | 0 |
| E Justice procedures offences | E10 Justice procedures | E19 Other justice procedures offences | 0 | 0 |
| E Justice procedures offences | E20 Breaches of orders | E21 Breach family violence order | 59 | 36 |
| E Justice procedures offences | E20 Breaches of orders | E22 Breach intervention order | 8 | 5 |
| E Justice procedures offences | E20 Breaches of orders | E23 Breach bail conditions | 9 | 3 |
| E Justice procedures offences | E20 Breaches of orders | E29 Breach of other orders | 0 | 1 |
| F Other offences | F10 Regulatory driving offences | F11 Drink driving | n.a. | 0 |
| F Other offences | F10 Regulatory driving offences | F12 Drug driving | 0 | n.a. |
| F Other offences | F10 Regulatory driving offences | F15 Licensing offences | n.a. | 0 |
| F Other offences | F10 Regulatory driving offences | F19 Other regulatory driving offences | 0 | 0 |
| F Other offences | F20 Transport regulation offences | F21 Public transport | 0 | 0 |
| F Other offences | F20 Transport regulation offences | F22 Aviation regulations offences | 0 | 0 |
| F Other offences | F20 Transport regulation offences | F23 Maritime regulations offences | 0 | 0 |
| F Other offences | F20 Transport regulation offences | F24 Pedestrian offences | 0 | 0 |
| F Other offences | F20 Transport regulation offences | F29 Other transport regulation offences | 0 | 0 |
| F Other offences | F30 Other government regulatory offences | F31 Betting and gaming offences | 0 | 0 |
| F Other offences | F30 Other government regulatory offences | F32 Commercial regulation offences | 0 | 0 |
| F Other offences | F30 Other government regulatory offences | F33 Liquor and tobacco licensing offences | 0 | 0 |
| F Other offences | F30 Other government regulatory offences | F34 Pornography and censorship offences | 0 | 0 |
| F Other offences | F30 Other government regulatory offences | F36 Prostitution offences | 0 | 0 |
| F Other offences | F30 Other government regulatory offences | F39 Other government regulatory offences | 0 | 0 |
| F Other offences | F90 Miscellaneous offences | F91 Environmental offences | 0 | 1 |
| F Other offences | F90 Miscellaneous offences | F92 Public health and safety offences | 12 | 8 |
| F Other offences | F90 Miscellaneous offences | F93 Cruelty to animals | 0 | 0 |
| F Other offences | F90 Miscellaneous offences | F94 Dangerous substance offences | 0 | 0 |
| F Other offences | F90 Miscellaneous offences | F99 Other miscellaneous offences | 0 | 0 |
Note: This article doesn’t have detailed data for family violence, victims, female offenders, reoffending, sexual offences, stalking, and youth crime. For more information about these topics, check our resources page.
References
- Crime Statistics Agency (CSA) Victoria
- Australian Bureau of Statistics (ABS) Census QuickStats for all persons
- Victoria Police
Popular Suburbs Near Lyndhurst
Greater Capital City Statistical Area
State