LnRiLWhlYWRpbmcuaGFzLWJhY2tncm91bmR7cGFkZGluZzowfQ==
LnRiLWdyaWQsLnRiLWdyaWQ+LmJsb2NrLWVkaXRvci1pbm5lci1ibG9ja3M+LmJsb2NrLWVkaXRvci1ibG9jay1saXN0X19sYXlvdXR7ZGlzcGxheTpncmlkO2dyaWQtcm93LWdhcDoyNXB4O2dyaWQtY29sdW1uLWdhcDoyNXB4fS50Yi1ncmlkLWl0ZW17YmFja2dyb3VuZDojZDM4YTAzO3BhZGRpbmc6MzBweH0udGItZ3JpZC1jb2x1bW57ZmxleC13cmFwOndyYXB9LnRiLWdyaWQtY29sdW1uPip7d2lkdGg6MTAwJX0udGItZ3JpZC1jb2x1bW4udGItZ3JpZC1hbGlnbi10b3B7d2lkdGg6MTAwJTtkaXNwbGF5OmZsZXg7YWxpZ24tY29udGVudDpmbGV4LXN0YXJ0fS50Yi1ncmlkLWNvbHVtbi50Yi1ncmlkLWFsaWduLWNlbnRlcnt3aWR0aDoxMDAlO2Rpc3BsYXk6ZmxleDthbGlnbi1jb250ZW50OmNlbnRlcn0udGItZ3JpZC1jb2x1bW4udGItZ3JpZC1hbGlnbi1ib3R0b217d2lkdGg6MTAwJTtkaXNwbGF5OmZsZXg7YWxpZ24tY29udGVudDpmbGV4LWVuZH0udGItZ3JpZCwudGItZ3JpZD4uYmxvY2stZWRpdG9yLWlubmVyLWJsb2Nrcz4uYmxvY2stZWRpdG9yLWJsb2NrLWxpc3RfX2xheW91dHtkaXNwbGF5OmdyaWQ7Z3JpZC1yb3ctZ2FwOjI1cHg7Z3JpZC1jb2x1bW4tZ2FwOjI1cHh9LnRiLWdyaWQtaXRlbXtiYWNrZ3JvdW5kOiNkMzhhMDM7cGFkZGluZzozMHB4fS50Yi1ncmlkLWNvbHVtbntmbGV4LXdyYXA6d3JhcH0udGItZ3JpZC1jb2x1bW4+Knt3aWR0aDoxMDAlfS50Yi1ncmlkLWNvbHVtbi50Yi1ncmlkLWFsaWduLXRvcHt3aWR0aDoxMDAlO2Rpc3BsYXk6ZmxleDthbGlnbi1jb250ZW50OmZsZXgtc3RhcnR9LnRiLWdyaWQtY29sdW1uLnRiLWdyaWQtYWxpZ24tY2VudGVye3dpZHRoOjEwMCU7ZGlzcGxheTpmbGV4O2FsaWduLWNvbnRlbnQ6Y2VudGVyfS50Yi1ncmlkLWNvbHVtbi50Yi1ncmlkLWFsaWduLWJvdHRvbXt3aWR0aDoxMDAlO2Rpc3BsYXk6ZmxleDthbGlnbi1jb250ZW50OmZsZXgtZW5kfS50Yi1jb250YWluZXIgLnRiLWNvbnRhaW5lci1pbm5lcnt3aWR0aDoxMDAlO21hcmdpbjowIGF1dG99IC53cC1ibG9jay10b29sc2V0LWJsb2Nrcy1jb250YWluZXIudGItY29udGFpbmVyW2RhdGEtdG9vbHNldC1ibG9ja3MtY29udGFpbmVyPSI4N2Y0ZmZiZGJiNGJkNTU3M2Y5OTNlYTAzNmMwZDQ3NyJdIHsgcGFkZGluZzogMDttYXJnaW4tdG9wOiAwOyB9IC50Yi1ncmlkLC50Yi1ncmlkPi5ibG9jay1lZGl0b3ItaW5uZXItYmxvY2tzPi5ibG9jay1lZGl0b3ItYmxvY2stbGlzdF9fbGF5b3V0e2Rpc3BsYXk6Z3JpZDtncmlkLXJvdy1nYXA6MjVweDtncmlkLWNvbHVtbi1nYXA6MjVweH0udGItZ3JpZC1pdGVte2JhY2tncm91bmQ6I2QzOGEwMztwYWRkaW5nOjMwcHh9LnRiLWdyaWQtY29sdW1ue2ZsZXgtd3JhcDp3cmFwfS50Yi1ncmlkLWNvbHVtbj4qe3dpZHRoOjEwMCV9LnRiLWdyaWQtY29sdW1uLnRiLWdyaWQtYWxpZ24tdG9we3dpZHRoOjEwMCU7ZGlzcGxheTpmbGV4O2FsaWduLWNvbnRlbnQ6ZmxleC1zdGFydH0udGItZ3JpZC1jb2x1bW4udGItZ3JpZC1hbGlnbi1jZW50ZXJ7d2lkdGg6MTAwJTtkaXNwbGF5OmZsZXg7YWxpZ24tY29udGVudDpjZW50ZXJ9LnRiLWdyaWQtY29sdW1uLnRiLWdyaWQtYWxpZ24tYm90dG9te3dpZHRoOjEwMCU7ZGlzcGxheTpmbGV4O2FsaWduLWNvbnRlbnQ6ZmxleC1lbmR9IC53cC1ibG9jay10b29sc2V0LWJsb2Nrcy1ncmlkLnRiLWdyaWRbZGF0YS10b29sc2V0LWJsb2Nrcy1ncmlkPSI3YjcwNzUwYzNmNDA0OTk4ZTJjOTYwYjA5NGE2MjJmMyJdIHsgZ3JpZC10ZW1wbGF0ZS1jb2x1bW5zOiBtaW5tYXgoMCwgMC41ZnIpIG1pbm1heCgwLCAwLjVmcik7Z3JpZC1jb2x1bW4tZ2FwOiAwcHg7Z3JpZC1yb3ctZ2FwOiAwcHg7Z3JpZC1hdXRvLWZsb3c6IHJvdyB9IC53cC1ibG9jay10b29sc2V0LWJsb2Nrcy1ncmlkLnRiLWdyaWRbZGF0YS10b29sc2V0LWJsb2Nrcy1ncmlkPSI3YjcwNzUwYzNmNDA0OTk4ZTJjOTYwYjA5NGE2MjJmMyJdIHAgeyBsaW5lLWhlaWdodDogNXB4OyB9IC53cC1ibG9jay10b29sc2V0LWJsb2Nrcy1ncmlkLnRiLWdyaWRbZGF0YS10b29sc2V0LWJsb2Nrcy1ncmlkPSI3YjcwNzUwYzNmNDA0OTk4ZTJjOTYwYjA5NGE2MjJmMyJdID4gLnRiLWdyaWQtY29sdW1uOm50aC1vZi10eXBlKDJuICsgMSkgeyBncmlkLWNvbHVtbjogMSB9IC53cC1ibG9jay10b29sc2V0LWJsb2Nrcy1ncmlkLnRiLWdyaWRbZGF0YS10b29sc2V0LWJsb2Nrcy1ncmlkPSI3YjcwNzUwYzNmNDA0OTk4ZTJjOTYwYjA5NGE2MjJmMyJdID4gLnRiLWdyaWQtY29sdW1uOm50aC1vZi10eXBlKDJuICsgMikgeyBncmlkLWNvbHVtbjogMiB9IC53cC1ibG9jay10b29sc2V0LWJsb2Nrcy1ncmlkLWNvbHVtbi50Yi1ncmlkLWNvbHVtbltkYXRhLXRvb2xzZXQtYmxvY2tzLWdyaWQtY29sdW1uPSIzMDM0ZmJlODg2YzExMDU0ZTk1YjQ2YjA5ZDNlNDExMiJdIHsgZGlzcGxheTogZmxleDsgfSAud3AtYmxvY2stdG9vbHNldC1ibG9ja3MtZ3JpZC1jb2x1bW4udGItZ3JpZC1jb2x1bW5bZGF0YS10b29sc2V0LWJsb2Nrcy1ncmlkLWNvbHVtbj0iMDkxNWIxOGFlZWI1MmJiYTBlYjNkOTMyMmI3NWZmOGYiXSB7IHBhZGRpbmctdG9wOiAyMHB4O3BhZGRpbmctYm90dG9tOiAyMHB4O2JvcmRlcjogMXB4IHNvbGlkIHJnYmEoIDQsIDYxLCAxMjIsIDEgKTtkaXNwbGF5OiBmbGV4OyB9IC53cC1ibG9jay10b29sc2V0LWJsb2Nrcy1ncmlkLWNvbHVtbi50Yi1ncmlkLWNvbHVtbltkYXRhLXRvb2xzZXQtYmxvY2tzLWdyaWQtY29sdW1uPSJhYWM4NjkxZDE0MDQ1ZmJjMDAxZjlhNzE5ZTQ4ZjQxZSJdIHsgcGFkZGluZy10b3A6IDIwcHg7cGFkZGluZy1ib3R0b206IDIwcHg7Ym9yZGVyOiAxcHggc29saWQgcmdiYSggNCwgNjEsIDEyMiwgMSApO2Rpc3BsYXk6IGZsZXg7IH0gaDMudGItaGVhZGluZ1tkYXRhLXRvb2xzZXQtYmxvY2tzLWhlYWRpbmc9ImI5ZTUwNGE4NGQ4ZjYwNWY1MDIxMmVlNTFkNGVjNmE1Il0gIHsgZm9udC1zaXplOiAxOHB4O2NvbG9yOiByZ2JhKCAyNTUsIDI1NSwgMjU1LCAxICk7dGV4dC1hbGlnbjogY2VudGVyO2JhY2tncm91bmQtY29sb3I6IHJnYmEoIDE5NSwgMTU2LCAzLCAxICk7cGFkZGluZy10b3A6IDIwcHg7cGFkZGluZy1ib3R0b206IDIwcHg7bWFyZ2luLWJvdHRvbTogMDsgfSAgLnRiLWNvbnRhaW5lciAudGItY29udGFpbmVyLWlubmVye3dpZHRoOjEwMCU7bWFyZ2luOjAgYXV0b30gLndwLWJsb2NrLXRvb2xzZXQtYmxvY2tzLWNvbnRhaW5lci50Yi1jb250YWluZXJbZGF0YS10b29sc2V0LWJsb2Nrcy1jb250YWluZXI9Ijg2MjY3OWEyZWMwNzAwN2I4OGEyNTc4Mjg3NDRiNDNiIl0geyBwYWRkaW5nOiAyNXB4O2JvcmRlcjogMXB4IHNvbGlkIHJnYmEoIDAsIDEyMiwgMjA0LCAxICk7IH0gQG1lZGlhIG9ubHkgc2NyZWVuIGFuZCAobWF4LXdpZHRoOiA3ODFweCkgeyAudGItZ3JpZCwudGItZ3JpZD4uYmxvY2stZWRpdG9yLWlubmVyLWJsb2Nrcz4uYmxvY2stZWRpdG9yLWJsb2NrLWxpc3RfX2xheW91dHtkaXNwbGF5OmdyaWQ7Z3JpZC1yb3ctZ2FwOjI1cHg7Z3JpZC1jb2x1bW4tZ2FwOjI1cHh9LnRiLWdyaWQtaXRlbXtiYWNrZ3JvdW5kOiNkMzhhMDM7cGFkZGluZzozMHB4fS50Yi1ncmlkLWNvbHVtbntmbGV4LXdyYXA6d3JhcH0udGItZ3JpZC1jb2x1bW4+Knt3aWR0aDoxMDAlfS50Yi1ncmlkLWNvbHVtbi50Yi1ncmlkLWFsaWduLXRvcHt3aWR0aDoxMDAlO2Rpc3BsYXk6ZmxleDthbGlnbi1jb250ZW50OmZsZXgtc3RhcnR9LnRiLWdyaWQtY29sdW1uLnRiLWdyaWQtYWxpZ24tY2VudGVye3dpZHRoOjEwMCU7ZGlzcGxheTpmbGV4O2FsaWduLWNvbnRlbnQ6Y2VudGVyfS50Yi1ncmlkLWNvbHVtbi50Yi1ncmlkLWFsaWduLWJvdHRvbXt3aWR0aDoxMDAlO2Rpc3BsYXk6ZmxleDthbGlnbi1jb250ZW50OmZsZXgtZW5kfS50Yi1ncmlkLC50Yi1ncmlkPi5ibG9jay1lZGl0b3ItaW5uZXItYmxvY2tzPi5ibG9jay1lZGl0b3ItYmxvY2stbGlzdF9fbGF5b3V0e2Rpc3BsYXk6Z3JpZDtncmlkLXJvdy1nYXA6MjVweDtncmlkLWNvbHVtbi1nYXA6MjVweH0udGItZ3JpZC1pdGVte2JhY2tncm91bmQ6I2QzOGEwMztwYWRkaW5nOjMwcHh9LnRiLWdyaWQtY29sdW1ue2ZsZXgtd3JhcDp3cmFwfS50Yi1ncmlkLWNvbHVtbj4qe3dpZHRoOjEwMCV9LnRiLWdyaWQtY29sdW1uLnRiLWdyaWQtYWxpZ24tdG9we3dpZHRoOjEwMCU7ZGlzcGxheTpmbGV4O2FsaWduLWNvbnRlbnQ6ZmxleC1zdGFydH0udGItZ3JpZC1jb2x1bW4udGItZ3JpZC1hbGlnbi1jZW50ZXJ7d2lkdGg6MTAwJTtkaXNwbGF5OmZsZXg7YWxpZ24tY29udGVudDpjZW50ZXJ9LnRiLWdyaWQtY29sdW1uLnRiLWdyaWQtYWxpZ24tYm90dG9te3dpZHRoOjEwMCU7ZGlzcGxheTpmbGV4O2FsaWduLWNvbnRlbnQ6ZmxleC1lbmR9LnRiLWNvbnRhaW5lciAudGItY29udGFpbmVyLWlubmVye3dpZHRoOjEwMCU7bWFyZ2luOjAgYXV0b30udGItZ3JpZCwudGItZ3JpZD4uYmxvY2stZWRpdG9yLWlubmVyLWJsb2Nrcz4uYmxvY2stZWRpdG9yLWJsb2NrLWxpc3RfX2xheW91dHtkaXNwbGF5OmdyaWQ7Z3JpZC1yb3ctZ2FwOjI1cHg7Z3JpZC1jb2x1bW4tZ2FwOjI1cHh9LnRiLWdyaWQtaXRlbXtiYWNrZ3JvdW5kOiNkMzhhMDM7cGFkZGluZzozMHB4fS50Yi1ncmlkLWNvbHVtbntmbGV4LXdyYXA6d3JhcH0udGItZ3JpZC1jb2x1bW4+Knt3aWR0aDoxMDAlfS50Yi1ncmlkLWNvbHVtbi50Yi1ncmlkLWFsaWduLXRvcHt3aWR0aDoxMDAlO2Rpc3BsYXk6ZmxleDthbGlnbi1jb250ZW50OmZsZXgtc3RhcnR9LnRiLWdyaWQtY29sdW1uLnRiLWdyaWQtYWxpZ24tY2VudGVye3dpZHRoOjEwMCU7ZGlzcGxheTpmbGV4O2FsaWduLWNvbnRlbnQ6Y2VudGVyfS50Yi1ncmlkLWNvbHVtbi50Yi1ncmlkLWFsaWduLWJvdHRvbXt3aWR0aDoxMDAlO2Rpc3BsYXk6ZmxleDthbGlnbi1jb250ZW50OmZsZXgtZW5kfSAud3AtYmxvY2stdG9vbHNldC1ibG9ja3MtZ3JpZC50Yi1ncmlkW2RhdGEtdG9vbHNldC1ibG9ja3MtZ3JpZD0iN2I3MDc1MGMzZjQwNDk5OGUyYzk2MGIwOTRhNjIyZjMiXSB7IGdyaWQtdGVtcGxhdGUtY29sdW1uczogbWlubWF4KDAsIDFmcik7Z3JpZC1hdXRvLWZsb3c6IHJvdyB9IC53cC1ibG9jay10b29sc2V0LWJsb2Nrcy1ncmlkLnRiLWdyaWRbZGF0YS10b29sc2V0LWJsb2Nrcy1ncmlkPSI3YjcwNzUwYzNmNDA0OTk4ZTJjOTYwYjA5NGE2MjJmMyJdICA+IC50Yi1ncmlkLWNvbHVtbjpudGgtb2YtdHlwZSgxbisxKSB7IGdyaWQtY29sdW1uOiAxIH0gLndwLWJsb2NrLXRvb2xzZXQtYmxvY2tzLWdyaWQtY29sdW1uLnRiLWdyaWQtY29sdW1uW2RhdGEtdG9vbHNldC1ibG9ja3MtZ3JpZC1jb2x1bW49IjMwMzRmYmU4ODZjMTEwNTRlOTViNDZiMDlkM2U0MTEyIl0geyBkaXNwbGF5OiBmbGV4OyB9IC53cC1ibG9jay10b29sc2V0LWJsb2Nrcy1ncmlkLWNvbHVtbi50Yi1ncmlkLWNvbHVtbltkYXRhLXRvb2xzZXQtYmxvY2tzLWdyaWQtY29sdW1uPSIwOTE1YjE4YWVlYjUyYmJhMGViM2Q5MzIyYjc1ZmY4ZiJdIHsgZGlzcGxheTogZmxleDsgfSAud3AtYmxvY2stdG9vbHNldC1ibG9ja3MtZ3JpZC1jb2x1bW4udGItZ3JpZC1jb2x1bW5bZGF0YS10b29sc2V0LWJsb2Nrcy1ncmlkLWNvbHVtbj0iYWFjODY5MWQxNDA0NWZiYzAwMWY5YTcxOWU0OGY0MWUiXSB7IGRpc3BsYXk6IGZsZXg7IH0gIC50Yi1jb250YWluZXIgLnRiLWNvbnRhaW5lci1pbm5lcnt3aWR0aDoxMDAlO21hcmdpbjowIGF1dG99IH0gQG1lZGlhIG9ubHkgc2NyZWVuIGFuZCAobWF4LXdpZHRoOiA1OTlweCkgeyAudGItZ3JpZCwudGItZ3JpZD4uYmxvY2stZWRpdG9yLWlubmVyLWJsb2Nrcz4uYmxvY2stZWRpdG9yLWJsb2NrLWxpc3RfX2xheW91dHtkaXNwbGF5OmdyaWQ7Z3JpZC1yb3ctZ2FwOjI1cHg7Z3JpZC1jb2x1bW4tZ2FwOjI1cHh9LnRiLWdyaWQtaXRlbXtiYWNrZ3JvdW5kOiNkMzhhMDM7cGFkZGluZzozMHB4fS50Yi1ncmlkLWNvbHVtbntmbGV4LXdyYXA6d3JhcH0udGItZ3JpZC1jb2x1bW4+Knt3aWR0aDoxMDAlfS50Yi1ncmlkLWNvbHVtbi50Yi1ncmlkLWFsaWduLXRvcHt3aWR0aDoxMDAlO2Rpc3BsYXk6ZmxleDthbGlnbi1jb250ZW50OmZsZXgtc3RhcnR9LnRiLWdyaWQtY29sdW1uLnRiLWdyaWQtYWxpZ24tY2VudGVye3dpZHRoOjEwMCU7ZGlzcGxheTpmbGV4O2FsaWduLWNvbnRlbnQ6Y2VudGVyfS50Yi1ncmlkLWNvbHVtbi50Yi1ncmlkLWFsaWduLWJvdHRvbXt3aWR0aDoxMDAlO2Rpc3BsYXk6ZmxleDthbGlnbi1jb250ZW50OmZsZXgtZW5kfS50Yi1ncmlkLC50Yi1ncmlkPi5ibG9jay1lZGl0b3ItaW5uZXItYmxvY2tzPi5ibG9jay1lZGl0b3ItYmxvY2stbGlzdF9fbGF5b3V0e2Rpc3BsYXk6Z3JpZDtncmlkLXJvdy1nYXA6MjVweDtncmlkLWNvbHVtbi1nYXA6MjVweH0udGItZ3JpZC1pdGVte2JhY2tncm91bmQ6I2QzOGEwMztwYWRkaW5nOjMwcHh9LnRiLWdyaWQtY29sdW1ue2ZsZXgtd3JhcDp3cmFwfS50Yi1ncmlkLWNvbHVtbj4qe3dpZHRoOjEwMCV9LnRiLWdyaWQtY29sdW1uLnRiLWdyaWQtYWxpZ24tdG9we3dpZHRoOjEwMCU7ZGlzcGxheTpmbGV4O2FsaWduLWNvbnRlbnQ6ZmxleC1zdGFydH0udGItZ3JpZC1jb2x1bW4udGItZ3JpZC1hbGlnbi1jZW50ZXJ7d2lkdGg6MTAwJTtkaXNwbGF5OmZsZXg7YWxpZ24tY29udGVudDpjZW50ZXJ9LnRiLWdyaWQtY29sdW1uLnRiLWdyaWQtYWxpZ24tYm90dG9te3dpZHRoOjEwMCU7ZGlzcGxheTpmbGV4O2FsaWduLWNvbnRlbnQ6ZmxleC1lbmR9LnRiLWNvbnRhaW5lciAudGItY29udGFpbmVyLWlubmVye3dpZHRoOjEwMCU7bWFyZ2luOjAgYXV0b30udGItZ3JpZCwudGItZ3JpZD4uYmxvY2stZWRpdG9yLWlubmVyLWJsb2Nrcz4uYmxvY2stZWRpdG9yLWJsb2NrLWxpc3RfX2xheW91dHtkaXNwbGF5OmdyaWQ7Z3JpZC1yb3ctZ2FwOjI1cHg7Z3JpZC1jb2x1bW4tZ2FwOjI1cHh9LnRiLWdyaWQtaXRlbXtiYWNrZ3JvdW5kOiNkMzhhMDM7cGFkZGluZzozMHB4fS50Yi1ncmlkLWNvbHVtbntmbGV4LXdyYXA6d3JhcH0udGItZ3JpZC1jb2x1bW4+Knt3aWR0aDoxMDAlfS50Yi1ncmlkLWNvbHVtbi50Yi1ncmlkLWFsaWduLXRvcHt3aWR0aDoxMDAlO2Rpc3BsYXk6ZmxleDthbGlnbi1jb250ZW50OmZsZXgtc3RhcnR9LnRiLWdyaWQtY29sdW1uLnRiLWdyaWQtYWxpZ24tY2VudGVye3dpZHRoOjEwMCU7ZGlzcGxheTpmbGV4O2FsaWduLWNvbnRlbnQ6Y2VudGVyfS50Yi1ncmlkLWNvbHVtbi50Yi1ncmlkLWFsaWduLWJvdHRvbXt3aWR0aDoxMDAlO2Rpc3BsYXk6ZmxleDthbGlnbi1jb250ZW50OmZsZXgtZW5kfSAud3AtYmxvY2stdG9vbHNldC1ibG9ja3MtZ3JpZC50Yi1ncmlkW2RhdGEtdG9vbHNldC1ibG9ja3MtZ3JpZD0iN2I3MDc1MGMzZjQwNDk5OGUyYzk2MGIwOTRhNjIyZjMiXSB7IGdyaWQtdGVtcGxhdGUtY29sdW1uczogbWlubWF4KDAsIDAuNWZyKSBtaW5tYXgoMCwgMC41ZnIpO2dyaWQtYXV0by1mbG93OiByb3cgfSAud3AtYmxvY2stdG9vbHNldC1ibG9ja3MtZ3JpZC50Yi1ncmlkW2RhdGEtdG9vbHNldC1ibG9ja3MtZ3JpZD0iN2I3MDc1MGMzZjQwNDk5OGUyYzk2MGIwOTRhNjIyZjMiXSA+IC50Yi1ncmlkLWNvbHVtbjpudGgtb2YtdHlwZSgybiArIDEpIHsgZ3JpZC1jb2x1bW46IDEgfSAud3AtYmxvY2stdG9vbHNldC1ibG9ja3MtZ3JpZC50Yi1ncmlkW2RhdGEtdG9vbHNldC1ibG9ja3MtZ3JpZD0iN2I3MDc1MGMzZjQwNDk5OGUyYzk2MGIwOTRhNjIyZjMiXSA+IC50Yi1ncmlkLWNvbHVtbjpudGgtb2YtdHlwZSgybiArIDIpIHsgZ3JpZC1jb2x1bW46IDIgfSAud3AtYmxvY2stdG9vbHNldC1ibG9ja3MtZ3JpZC1jb2x1bW4udGItZ3JpZC1jb2x1bW5bZGF0YS10b29sc2V0LWJsb2Nrcy1ncmlkLWNvbHVtbj0iMzAzNGZiZTg4NmMxMTA1NGU5NWI0NmIwOWQzZTQxMTIiXSB7IGRpc3BsYXk6IGZsZXg7IH0gLndwLWJsb2NrLXRvb2xzZXQtYmxvY2tzLWdyaWQtY29sdW1uLnRiLWdyaWQtY29sdW1uW2RhdGEtdG9vbHNldC1ibG9ja3MtZ3JpZC1jb2x1bW49IjA5MTViMThhZWViNTJiYmEwZWIzZDkzMjJiNzVmZjhmIl0geyBkaXNwbGF5OiBmbGV4OyB9IC53cC1ibG9jay10b29sc2V0LWJsb2Nrcy1ncmlkLWNvbHVtbi50Yi1ncmlkLWNvbHVtbltkYXRhLXRvb2xzZXQtYmxvY2tzLWdyaWQtY29sdW1uPSJhYWM4NjkxZDE0MDQ1ZmJjMDAxZjlhNzE5ZTQ4ZjQxZSJdIHsgZGlzcGxheTogZmxleDsgfSAgLnRiLWNvbnRhaW5lciAudGItY29udGFpbmVyLWlubmVye3dpZHRoOjEwMCU7bWFyZ2luOjAgYXV0b30gfSA=
NSW Crime Map
New South Wales Crime Statistics at a Glance
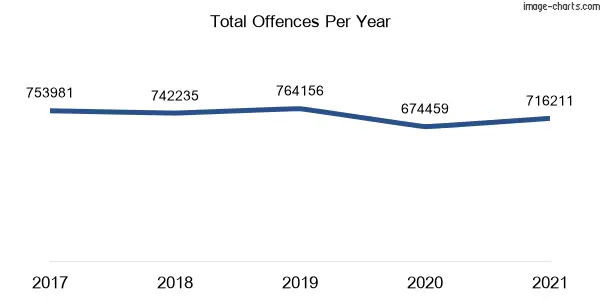
The chart illustrates the trend in the number of offences that happened in New South Wales over the past 60 months.
- In 2021, there was a 6.2% increase (41752 Incidents) in total criminal incidents compared to the previous year.
- When considering our safety metrics across all Australian states, New South Wales has been found to rank third. This means that NSW is performing relatively well compared to other states, with only two states ahead of it in terms of overall safety.
- The number of criminal incidents of Assault decreased by 2.3% (1469 Incidents) from 2020 to 2021.
- The number of Sexual offences recorded in 2021 decreased by 1.8% (270 Incidents) compared to the previous year.
- The number of Homicide offences recorded in 2021 decreased by 28.7% (29 Incidents) compared to the previous year.
- The number of Burglary offences recorded in 2021 decreased by 7.8% (2115 Incidents) compared to the previous year.
- The number of Theft offences recorded in 2021 decreased by 5.9% (11219 Incidents) compared to the previous year.
- The number of Robbery offences recorded in 2021 decreased by 16.9% (357 Incidents) compared to the previous year.
- The number of Motor Vehicle Thefts recorded in 2021 decreased by 10.7% (1258 Incidents) compared to the previous year.
- The number of Vandalism offences (Property damage) recorded in 2021 decreased by 7.8% (4180 Incidents) compared to the previous year.
Thinking of moving to NSW?
Experience the ease of moving with Muval, the ‘Uber for removals,’ backed by over 35,000 successful moves. Tap into Australia’s largest network of verified removalists nationwide. Compare prices & reviews, book, and move smoothly with Muval now!
Crime in NSW: An In-Depth Analysis
In the year 2021-22, the police in New South Wales proceeded against 134,571 offenders, which is 22% higher than the previous year. This increase was due to a rise in miscellaneous offences, such as COVID-19-related violations, with 37,221 offenders being charged. The offender rate in New South Wales also increased from 1,542 to 1,892 offenders per 100,000 persons in 2021-22.
The most common principal offence types in New South Wales were miscellaneous offences and acts intended to cause injury, with 28% and 26% of offenders respectively. The offender rate for miscellaneous offences increased from 80 to 523 offenders per 100,000 in 2021-22. However, for all other offence types except acts intended to cause injury, the offender rates remained the same or decreased compared to the previous year.
Illicit drug offences decreased by 18% in New South Wales, with 2,616 fewer offenders charged in 2021-22 than in the previous year. This marks the state’s fourth consecutive annual decrease in illicit drug offences.
As for the gender distribution of offenders, 75% of the offenders in New South Wales were male, with the male offender rate being more than three times that of female offenders. Among youth aged between 10 and 17 years, the offender rate was higher than that of the overall population, with fare evasion and acts intended to cause injury being the most common offences committed.
Finally, 17,469 Aboriginal and Torres Strait Islander offenders were charged in 2021-22, with more than half having a principal offence of acts intended to cause injury. In terms of police proceedings, there were 238,434 proceedings in total, with over half of them being non-court actions, mainly due to fines issued for COVID-19-related offences.
Looking to understand the various types of criminal offences in New South Wales and make sense of crime data? Check out our NSW crime glossary for easy-to-understand definitions of common criminal offences.
NSW Crime Rate by Offences Division
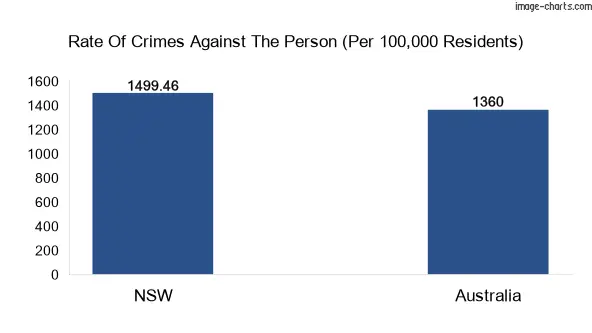
NSW Crimes Against the Person
My Chances of Becoming a Victim of a Crime Against the Person
Crimes Against the Person Comparison (Per 100,000 Residents)
Breakdown of Crimes Against the Person in NSW
Here is a breakdown of the major crimes against the person (violent crimes) including the number of offences and NSW crime rates for the selected offences.
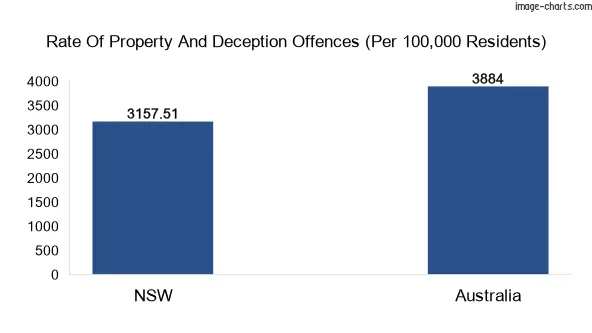
NSW Property and Deception Offences
My Chances of Becoming a Victim of a Crime Against the Person
Property and Deception Offences Comparison (Per 100,000 Residents)
Breakdown of Property and Deception Offences in NSW
An overview of the major property and deception offences, including NSW crime statistics for each offence type.
Drug Offences
Details of Drug Offences in New South Wales
Public Order and Security Offences
Breakdown of Public Order and Security Offences in NSW
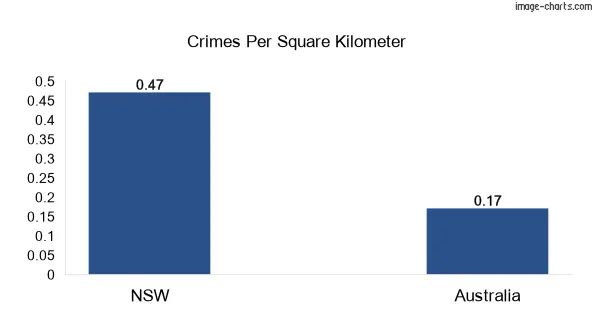
NSW Crimes per Square KM
NSW Crime FAQs
How many murders were in NSW in 2021?
According to the New South Wales Police Force and BOSCAR data, there were 51 murders in NSW in 2021. The number of homicides (which includes murders, attempted murder, murder conspiracy, and manslaughters) was 72.
What’s the most common crime in NSW?
According to the latest available data from the New South Wales Bureau of Crime Statistics and Research, the most common type of crime in NSW is Breach bail conditions.
What is the crime rate in NSW?
The overall crime rate in NSW, as measured by the number of reported offences per 100,000 population was 8769 offences per 100,000 population in the year ending December 2021.
However, it’s important to note that this is an aggregate figure that includes all types of crime, and some types of offences are more prevalent than others. Additionally, crime rates can vary by location, with some areas experiencing higher rates of certain types of crime than others.
Is NSW a safe place to live in?
NSW ranks third in overall safety among Australian states. According to BOCSAR, NSW total crime rate in 2021 was 8768. So, NSW is considered a safe and welcoming place to live and visit.
Is NSW safe at night?
39% of crimes in NSW occurs between 6 PM and 6 AM so, it’s fairly safe to walk alone in NSW at night.
What suburb has the highest crime rate in NSW?
Maitland is the suburb with the highest rate of reported criminal incidents in NSW with a rate of 132,955 incidents per 100,000 population, according to BOCSAR’s 2021 data. Yet, Maitland is safer than only 0.7% of NSW suburbs.
What is the safest suburb in NSW?
Green Point (Gosford) is the safest suburb in Sydney with a rate of 15 incidents per 100,000 population as per BOCSAR’s 2021 report. Green Point (Gosford) is safer than 100% of New South Wales suburbs.
However, it’s important to note that low crime rates do not necessarily guarantee safety, and that crime can occur anywhere, so it’s important to always stay vigilant and take appropriate safety measures.
- NSW Police public site
- NSW Bureau of Crime Statistics and Research (BOCSAR).
- Australian Bureau of Statistics (ABS) Census QuickStats for all persons
Popular Urban Areas Near NSW