According to ACT Policing, ACT crime rate for the year ending December 2021 was 7839 incidents per 100,000 population. This represents a 13% decrease from the previous year.
ACT Safety Rank
2
(1 is safest)
ACT holds the 2nd rank in safety metrics among all Australia states
ACT Crime Map
Has crime in ACT increased or decreased in the past 5 years? The chart below shows the 60-month historical trend of the number of offences that occurred in ACT.
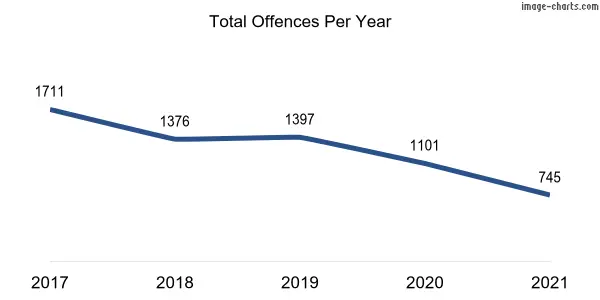
- The number of criminal incidents recorded by ACT Policing in the year 2021 was 35569, down 13% from 41059 incidents recorded in the same period last year.
- When considering our safety metrics across all Australian states, ACT has been found to rank second. This means that ACT is performing well compared to other states, with only one state ahead of it in terms of overall safety.
- Common crime: theft (excluding motor vehicles).
- The suburb of Forde has been consistently ranked as the safest suburb in ACT in terms of crime rates.
- Top areas to avoid: Belconnen suburb.
- The number of assault offences recorded in 2021 increased by 5% (127 Incidents) compared to the previous year..
- The number of sexual offences recorded in 2021 increased by 5% (24 Incidents) compared to the previous year.
- The number of homicide offences recorded in 2021 increased by 50% (5 Incidents) compared to the previous year.
- The number of burglary offences recorded in 2021 decreased by 4% (86 Incidents) compared to the previous year.
- The number of theft offences (excluding motor vehicles) recorded in 2021 increased by 11% (773 Incidents) compared to the previous year.
- The number of robbery offences recorded in 2021 increased b 2% (4 Incidents) compared to the previous year.
- The number of motor vehicle thefts recorded in 2021 increased by 16% (193 Incidents) compared to the previous year.
- The number of property damage offences recorded in 2021 decreased by 1% (44 Incidents) compared to the previous year.
Thinking of moving to ACT?
Experience the ease of moving with Muval, the ‘Uber for removals,’ backed by over 35,000 successful moves. Tap into Australia’s largest network of verified removalists nationwide. Compare prices & reviews, book, and move smoothly with Muval now!
Crime in ACT: An In-Depth Analysis
In 2021–22, the Australian Capital Territory saw police actions against 2,328 individuals, marking a 5% rise from the prior year. Yet, when adjusted for population shifts during this period, the rate of offenders actually dipped marginally, going from 593 per 100,000 people in 2020–21 to 586 per 100,000 in 2021–22.
The predominant crime was acts intended to cause injury, accounting for 32% of cases with 742 offenders. Between 2020–21 and 2021–22, this category saw a 12% increase in offenders, rising by 80 individuals, with the rate climbing from 177 to 187 offenders per 100,000 people. Notably, the count of offenders charged with miscellaneous offences, including COVID-19-related infractions, surged more than sixfold compared to 2020–21, reaching 166. Consequently, the rate of these offences also rose significantly, from 7 to 42 offenders per 100,000 people.
In the Australian Capital Territory, males comprised the majority of offenders, totaling 1,810 or 78% of the total. The rate of male offenders was significantly higher than that of females, being more than three and a half times greater. Specifically, there were 928 male offenders per 100,000 males compared to 256 female offenders per 100,000 females.
In 2021–22, offenders aged 10 to 17 years (youth offenders) made up 10% of the total offenders in the Australian Capital Territory, numbering 223. This age group had a lower offender rate compared to the overall offender population in the territory, with 529 youth offenders per 100,000 individuals aged between 10 and 17 years, versus 586 offenders per 100,000 for the total population. Additionally, acts intended to cause injury were the main offense for more than a third (38%) of these youth offenders, totaling 85 individuals.
The number of Aboriginal and Torres Strait Islander offenders rose by 5% from the previous year, totaling 391. The most frequent primary offense among these individuals was acts intended to cause injury, accounting for 39% of cases, or 152 offenders.
In the Australian Capital Territory during 2021–22, police undertook 3,185 proceedings, marking a 4% rise from the previous year. A significant majority of these, 83% or 2,640 proceedings, involved court actions.
ACT Crime Rates by Offences Division
| Division | Number of Crimes | Crime Rate (Per 100,000 Residents) |
|---|---|---|
| Offences against the person | 3816 | 841 |
| Offences against Property | 15147 | 3338 |
| Other Offences | 16606 | 3660 |
| Total | 35569 | 7839 |
ACT Crimes Against the Person
These are violent crimes against people whether these are family violence or non-family violence. Basically, if someone does something to hurt or scare another person, it’s considered a crime against the person. This includes:
- Assault: According to ACT Policing, assault is an action aimed at inflicting non-lethal harm or injury to another individual, without any sexual or materialistic motives, and excluding attempts at murder or acts leading to death.
- Robbery: Robbery involves illegally seizing someone’s property with the intention to permanently keep it, taken directly from the person’s possession, control, or custody, often involving or threatening immediate physical force or violence.
- Homicide refers to the illegal act of killing or attempting to kill another person or conspiring to do so. This encompasses murder, attempted murder, and manslaughter resulting in death.
- Sexual assault is defined as any physical contact or attempted contact of a sexual nature towards another individual without their consent, or where consent is obtained through intimidation or deception. It also applies when consent is legally invalid due to factors like the individual’s age, mental incapacity (temporary or permanent), or a familial relationship.
- “Other offences against the person” encompass acts aimed at threatening or harassing an individual, or unlawfully restricting their freedom of movement against their will or the will of their legal guardian or caretaker. This category includes crimes such as abduction and kidnapping, false imprisonment or deprivation of liberty, and various forms of harassment and threatening behaviour.
My Chances of Becoming a Victim of a Crime Against the Person
1 in 118
In ACT
1 in 73
In Australia
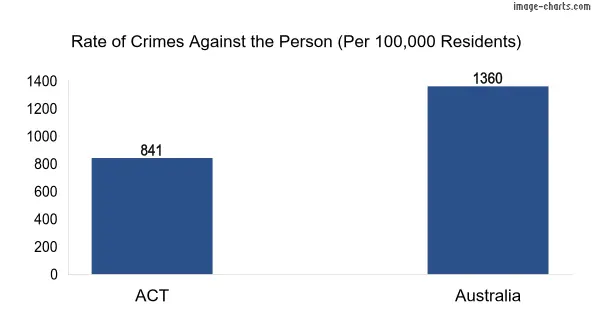
Crimes Against the Person Comparison (Per 100,000 Residents)
Breakdown of Against the Person Offences in ACT
ACT population: 453764
| Crimes | ACT Total Criminal Incidents | ACT Crime Rate (per 100,000 residents) |
|---|---|---|
| Homicide | 15 | 3 |
| Assault | 2822 | 622 |
| Sexual offences | 537 | 118 |
| Robbery | 172 | 38 |
| Other offences against the person | 270 | 60 |
ACT Against Property Offences
These are crimes related to stealing or damaging property or deceiving someone for personal gain. Property crimes include:
- Theft (excluding Motor Vehicles): Theft, excluding the stealing of motor vehicles, is the illegal act of taking or acquiring money, goods, services, or non-motorized vehicles without employing force, threat of force, violence, coercion, or deception. The intent behind this act is to permanently deprive the owner or possessor of the use of their money, goods, or services.
- Burglary (unlawful entry): Burglary is defined as the illegal entry into a structure, whether by force or not, with the intention to commit a crime. A structure in this context is any building enclosed by walls and capable of being secured, such as a house, flat, caravan, office, bank, shop, factory, school, or church.
- Stolen motor vehicles: The theft of motor vehicles involves illegally taking another person’s motor vehicle without authorization, intending to deprive the owner or possessor of its use, either temporarily or permanently. This category covers both the illegal use of a motor vehicle and the theft of a motor vehicle.
- Property damage: This refers to intentional or accidental harm caused to someone else’s property, such as vandalism, fire or explosion, and graffiti.
My Chances of Becoming a Victim of Against Property offences
1 in 29
In ACT
1 in 25
In Australia
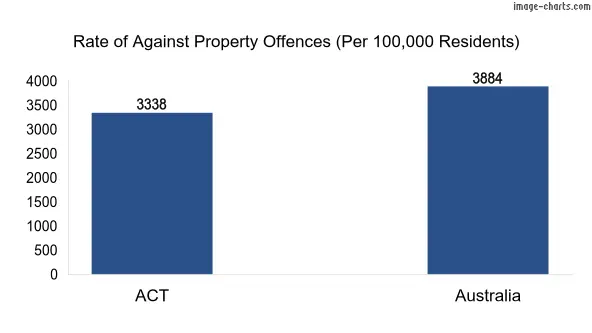
Crimes Against Property Comparison (Per 100,000 Residens)
Breakdown of Against Property Offences in ACT
ACT population: 453764
| Crimes | ACT Total Criminal Incidents | ACT Crime Rate (per 100,000 residents) |
|---|---|---|
| Theft (excluding Motor Vehicles) | 7919 | 1745 |
| Motor vehicle theft | 1425 | 314 |
| Burglary/Break and enter | 1986 | 438 |
| Property damage | 3817 | 841 |
Other Offences
“Other offences” encompass a wide range of criminal acts not covered under specific categories. This includes but is not limited to, offences related to deception, environmental crimes, weapons violations, drug offences, public order breaches, and driving-related offences.
Breakdown of Other Offences in ACT
| Crimes | ACT Total Criminal Incidents | ACT Crime Rate (per 100,000 residents) |
|---|---|---|
| MISC. offences | 10223 | 2253 |
| Traffic offences | 6280 | 1384 |
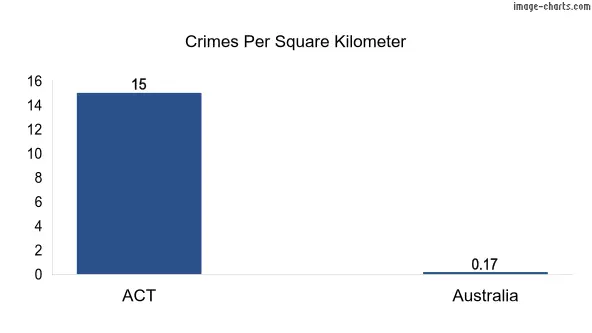
ACT Crimes per Square KM
How many murders in ACT in 2021?
According to ACT Policing, there were 15 homicides in ACT in 2021. It’s important to note that this figure includes all homicides, not just murders.
What’s the most common crime in ACT?
According to the latest available data from ACT Policing, the most common type of crime in ACT is theft (excluding motor vehicles).
What is the crime rate in ACT?
The overall crime rate in ACT, as measured by the number of reported offences per 100,000 population was 7839 in the year ending December 2021.
However, it’s important to note that this is an aggregate figure that includes all types of crime, and some types of offences are more prevalent than others. Additionally, crime rates can vary by location, with some areas experiencing higher rates of certain types of crime than others.
Is ACT a safe place to live in?
ACT ranks second in overall safety among Australian states. According to the ACT Policing, ACT’s total crime rate in 2021 was 9478. So, ACT is considered a safe and welcoming place to live and visit.
What suburb has the highest crime rate in ACT?
Belconnen is the suburb with the highest rate of reported criminal incidents in ACT with a rate of 26077 incidents per 100,000 population, according to BOCSAR 2022 data. Belconnen is safer than only 9% of ACT suburbs.
What is the safest suburb in ACT?
Forde is the safest suburb in ACT with a rate of 2254 incidents per 100,000 population as per the BOCSAR report. Forde is safer than 95% of ACT suburbs.
However, it’s important to note that low crime rates do not necessarily guarantee safety, and that crime can occur anywhere. Hence, it’s essential always to stay vigilant and take appropriate safety measures.
Note: This article doesn’t have detailed data for family violence, victims, female offenders, reoffending, stalking, and youth crime. For more information about these topics, check our resources page. check our resources page.
References
- ACT Policing
- Australian Bureau of Statistics (ABS) Census QuickStats for all persons
Popular Suburbs in ACT
Popular Urban Areas in ACT