According to ACT Policing, Canberra crime rate for the year ending December 2021 was 5318 incidents per 100,000 population. This represents a 13%decrease from the previous year.
Canberra Crime Index
69
(100 is safest)
Safer than 69% of most Australia cities
Canberra Crime Map
Is Canberra Safe?
Crime rates in Canberra are below average to all cities and towns in Australia. Canberra is safer than 69% of all Australian communities. However, theft (excluding Motor Vehicles) is a common offence in Canberra.
A guide from Kate Abroad specifically mentions that Canberra is very safe for solo female travelers. The presence of numerous embassies and government buildings contributes to the high level of security in the city.
Canberra Crime Statistics at a Glance
Has crime in Canberra increased or decreased in the past 5 years? The chart below shows the 60-month historical trend of the number of offences that occurred in Canberra.
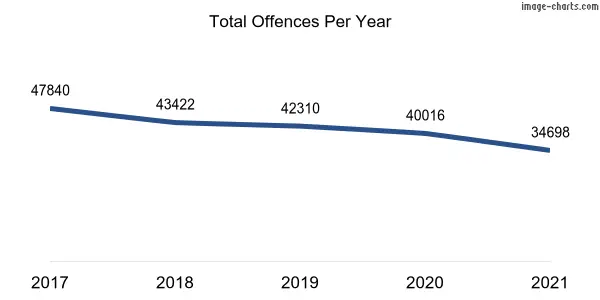
The number of criminal incidents recorded by ACT Policing in the year 2021 was 34698 down 13% from 40016 incidents recorded in the same period last year.
- Common crime: theft (excluding Motor Vehicles).
- The suburb of Forde has been consistently ranked as the safest suburb in Canberra in terms of crime rates.
- Top areas to avoid: Belconnen suburb.
- The number of assault offences recorded in 2021 increased by 5% (127 Incidents) compared to the previous year..
- The number of sexual offences recorded in 2021 increased by 4% (23 Incidents) compared to the previous year.
- The number of homicide offences recorded in 2021 increased by 20% (2 Incidents) compared to the previous year.
- The number of burglary offences recorded in 2021 decreased by 4% (76 Incidents) compared to the previous year.
- The number of theft offences (excluding motor vehicles) recorded in 2021 increased by 11% (776 Incidents) compared to the previous year.
- The number of robbery offences recorded in 2021 increased b 2% (4 Incidents) compared to the previous year.
- The number of motor vehicle thefts recorded in 2021 increased by 16% (189 Incidents) compared to the previous year.
- The number of property damage offences recorded in 2021 increased by 2% (70 Incidents) compared to the previous year.
Thinking of moving to Canberra?
Experience the ease of moving with Muval, the ‘Uber for removals,’ backed by over 35,000 successful moves. Tap into Australia’s largest network of verified removalists nationwide. Compare prices & reviews, book, and move smoothly with Muval now!
Crime in Canberra: An In-Depth Analysis
Based on the latest crime statistics from the ACT Policing, AU Crime Rate’s analysis indicates that Canberra is safer than 69% of all communities across the nation, regardless of population size. This implies that Canberra’s crime rate is below average compared to all cities and towns in Australia.
As a resident of Canberra, the likelihood of becoming a victim of crime is 1 in 23 based on the combined crime rate of offences against the person and property. This is the same as the ACT average, where the chance of becoming a victim of crime is also 1 in 23.
To get a more comprehensive understanding of Canberra’s crime statistics, it is essential to take a closer look at its against the person and property crime data. This examination is particularly critical because it enables us to determine whether violent crime, property crime, or both are the primary contributors to the total crime rate in Canberra. By doing so, we can gain a more in-depth insight into the nature and extent of crime in Canberra.
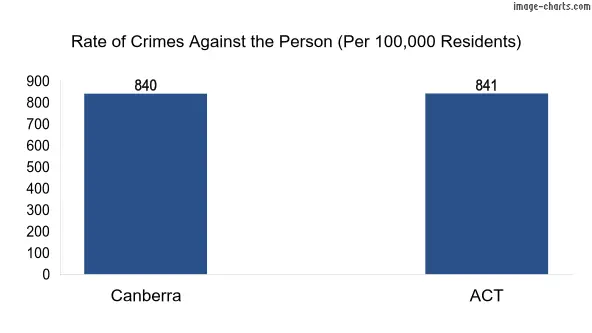
AU Crime Rate’s analysis has uncovered that the rate of crimes against the person in Canberra is 840 per one hundred thousand inhabitants. It’s worth noting that the statewide average for such crimes stands at 841. This suggests that experiencing serious offences like homicide, assault, robbery, sexual offences, and other offences against the person is 1 in 118 if you reside in Canberra.
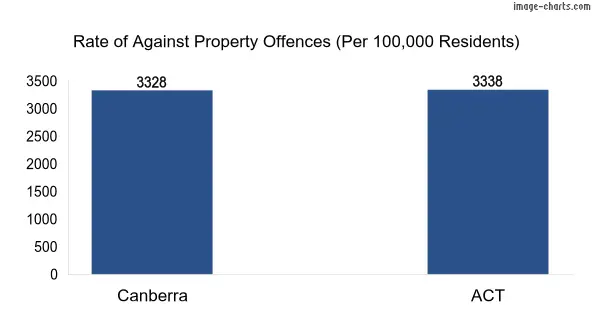
Our data reveal that the odds of becoming a victim of property crime in Canberra are 1 in 29, with a rate of 3328 incidents per 100,000 residents. Keep in mind that the ACT average is also 3338 incidents per 100,000 residents. The types of property crimes tracked in this analysis include theft, motor vehicle theft, burglary, and property damage.
Canberra Crime Rates by Offences Division
| Division | Number of Crimes | Crime Rate (Per 100,000 Residents) |
|---|---|---|
| Offences against the person | 3801 | 840 |
| Offences against Property | 15061 | 3328 |
| Other Offences | 15836 | 3499 |
| Total | 34698 | 7667 |
Canberra Crimes Against the Person
These are violent crimes against people whether these are family violence or non-family violence. Basically, if someone does something to hurt or scare another person, it’s considered a crime against the person. This includes:
- Assault: According to ACT Policing, assault is an action aimed at inflicting non-lethal harm or injury to another individual, without any sexual or materialistic motives, and excluding attempts at murder or acts leading to death.
- Robbery: Robbery involves illegally seizing someone’s property with the intention to permanently keep it, taken directly from the person’s possession, control, or custody, often involving or threatening immediate physical force or violence.
- Homicide refers to the illegal act of killing or attempting to kill another person or conspiring to do so. This encompasses murder, attempted murder, and manslaughter resulting in death.
- Sexual assault is defined as any physical contact or attempted contact of a sexual nature towards another individual without their consent, or where consent is obtained through intimidation or deception. It also applies when consent is legally invalid due to factors like the individual’s age, mental incapacity (temporary or permanent), or a familial relationship.
- “Other offences against the person” encompass acts aimed at threatening or harassing an individual, or unlawfully restricting their freedom of movement against their will or the will of their legal guardian or caretaker. This category includes crimes such as abduction and kidnapping, false imprisonment or deprivation of liberty, and various forms of harassment and threatening behaviour.
My Chances of Becoming a Victim of a Crime Against the Person
1 in 118
In Canberra
1 in 118
In ACT
Crimes Against the Person Comparison (Per 100,000 Residents)
Crimes Against the Person: Canberra vs ACT
Canberra population: 452537
ACT population: 453764
| Crimes | Canberra Total Criminal Incidents | ACT Total Criminal Incidents | Canberra Crime Rate (Per 100,000 Residents) | ACT Crime Rate (per 100,000 residents) |
|---|---|---|---|---|
| Homicide | 12 | 15 | 3 | 3 |
| Assault | 2816 | 2822 | 622 | 622 |
| Sexual offences | 536 | 537 | 118 | 118 |
| Robbery | 171 | 172 | 38 | 38 |
| Other offences against the person | 266 | 270 | 59 | 60 |
Canberra Against Property offences
These are crimes related to stealing or damaging property or deceiving someone for personal gain. Property crimes include:
- Theft (excluding Motor Vehicles): Theft, excluding the stealing of motor vehicles, is the illegal act of taking or acquiring money, goods, services, or non-motorized vehicles without employing force, threat of force, violence, coercion, or deception. The intent behind this act is to permanently deprive the owner or possessor of the use of their money, goods, or services.
- Burglary (unlawful entry): Burglary is defined as the illegal entry into a structure, whether by force or not, with the intention to commit a crime. A structure in this context is any building enclosed by walls and capable of being secured, such as a house, flat, caravan, office, bank, shop, factory, school, or church.
- Stolen motor vehicles: The theft of motor vehicles involves illegally taking another person’s motor vehicle without authorization, intending to deprive the owner or possessor of its use, either temporarily or permanently. This category covers both the illegal use of a motor vehicle and the theft of a motor vehicle.
- Property damage: This refers to intentional or accidental harm caused to someone else’s property, such as vandalism, fire or explosion, and graffiti.
My Chances of Becoming a Victim of Against Property offences
1 in 29
In Canberra
1 in 29
In ACT
Crimes Against Property Comparison (Per 100,000 Residents)
Against Property offences: Canberra vs ACT
Canberra population: 452537
ACT population: 453764
| Crimes | Canberra Total Criminal Incidents | ACT Total Criminal Incidents | Canberra Crime Rate (Per 100,000 Residents) | ACT Crime Rate (per 100,000 residents) |
|---|---|---|---|---|
| Theft (excluding Motor Vehicles) | 7881 | 7919 | 1742 | 1745 |
| Motor vehicle theft | 1404 | 1425 | 310 | 314 |
| Burglary/Break and enter | 1979 | 1986 | 437 | 438 |
| Property damage | 3797 | 3817 | 839 | 841 |
Other Offences
“Other offences” encompass a wide range of criminal acts not covered under specific categories. This includes but is not limited to, offences related to deception, environmental crimes, weapons violations, drug offences, public order breaches, and driving-related offences.
Other Offences: Canberra vs ACT
| Crimes | Canberra Total Criminal Incidents | ACT Total Criminal Incidents | Canberra Crime Rate (Per 100,000 Residents) | ACT Crime Rate (per 100,000 residents) |
|---|---|---|---|---|
| MISC. offences | 10066 | 10223 | 2224 | 2253 |
| Traffic offences | 5670 | 6280 | 1253 | 1384 |
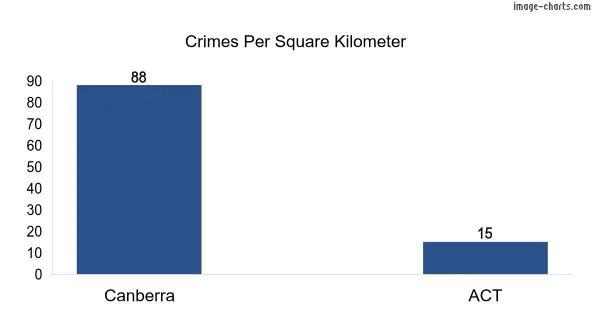
Canberra Crimes per Square KM
How many murders in Canberra in 2021?
According to ACT Policing, there were 12 homicides in Canberra in 2021. It’s important to note that this figure includes all homicides, not just murders.
What’s the most common crime in Canberra?
According to the latest available data from ACT Policing, the most common type of crime in Canberra is theft (excluding Motor Vehicles).
What is the crime rate in Canberra?
The overall crime rate in Canberra, as measured by the number of reported offences per 100,000 population was 7667 in the year ending December 2021.
However, it’s important to note that this is an aggregate figure that includes all types of crime, and some types of offences are more prevalent than others. Additionally, crime rates can vary by location, with some areas experiencing higher rates of certain types of crime than others.
Is Canberra a safe place to live?
Canberra is safer than 69% of cities and towns across Australia and the crime rates are below average to all cities and towns in Australia.
While no city is completely free from crime, Canberra is widely regarded as a safe city with a generally low crime rate, especially when compared to other major cities. Its safety is further enhanced by the presence of many official buildings and embassies.
What suburb has the highest crime rate in Canberra?
Belconnen is the suburb with the highest rate of reported criminal incidents in Canberra with a rate of 26077 incidents per 100,000 population, according to BOCSAR 2022 data. Belconnen is safer than only 9% of Canberra suburbs.
What is the safest suburb in Canberra?
Forde is the safest suburb in Canberra with a rate of 2254 incidents per 100,000 population as per the BOCSAR report. Forde is safer than 95% of Canberra suburbs.
However, it’s important to note that low crime rates do not necessarily guarantee safety, and that crime can occur anywhere. Hence, it’s essential always to stay vigilant and take appropriate safety measures.
Popular Suburbs Near Canberra