According to the Crime Statistics Agency (CSA) Victoria, Cranbourne East crime rate for the year ending June 2022 was 3418 incidents per 100,000 population. This represents a 13% decrease from the previous year.
Cranbourne East Crime Index
64
(100 is safest)
Safer than 64% of most Australia suburbs
Cranbourne East Crime Map
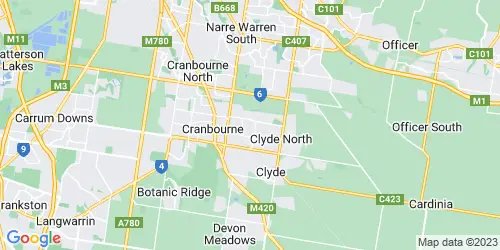
Is Cranbourne East Safe?
Cranbourne East has high safety metrics. Crime rates in Cranbourne East are below average to the majority of suburbs in Australia. Cranbourne East is safer than 64% of all Australian suburbs and than 55% of Victoria suburbs. However, steal from a motor vehicle is a common offence in Cranbourne East.
Cranbourne East Crime Statistics at a Glance
Has Crime in Cranbourne East increased or decreased in the past 5 years? The chart below shows the 60-month historical trend of the number of offences that occurred in Cranbourne East.
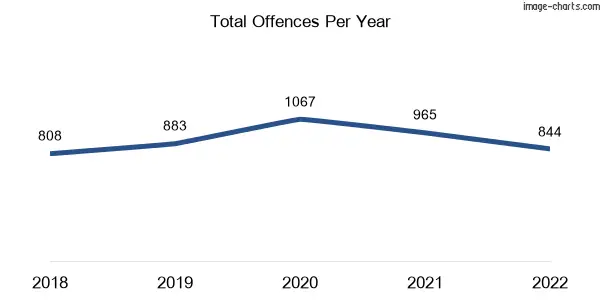
- The number of criminal incidents recorded by Victoria Police in the year 2022 was 844, down 13% from 965 incidents recorded in the same period last year.
- Cranbourne East is in the 55th percentile for safety, meaning 45% of Victoria suburbs are safer than Cranbourne East and 55% of suburbs are more dangerous than Cranbourne East.
- Common crime: steal from a motor vehicle.
- The number of assault offences recorded in 2022 decreased by 21% (29 Incidents) compared to the previous year..
- The number of deception offences recorded in 2022 decreased by 4% (2 Incidents) compared to the previous year.
- The number of burglary offences recorded in 2022 increased by 21% (8 Incidents) compared to the previous year.
- There was no change in the number of theft offences recorded during the years 2021 and 2022.
- The number of robbery offences recorded in 2022 increased by 22% (2 Incidents) compared to the previous year.
- The number of motor vehicle thefts recorded in 2022 decreased by 10% (3 Incidents) compared to the previous year.
- The number of vandalism offences (Property damage) recorded in 2022 decreased by 28% (27 Incidents) compared to the previous year.
Thinking of moving to Cranbourne East?
Experience the ease of moving with Muval, the ‘Uber for removals,’ backed by over 35,000 successful moves. Tap into Australia’s largest network of verified removalists nationwide. Compare prices & reviews, book, and move smoothly with Muval now!
Crime in Cranbourne East: An In-Depth Analysis
AU Crime Rate’s analysis of recent crime data from the Crime Statistics Agency (CSA) Victoria reveals that Cranbourne East’s crime rate is below average to the majority of suburbs in Australia, as it is ranked safer than only 64% of suburbs across the country, irrespective of population size.
Approximately 45% of Victoria suburbs have a lower crime rate compared to Cranbourne East. Therefore, Cranbourne East’s public safety metrics are generally considered high.
How risky is that? Living in Cranbourne East comes with a statistical risk of 1 in 38 of becoming a victim of crime, considering the total rate of crimes against the person and property. In contrast, the average chance of falling victim to crime in Victoria stands at 1 in 19.
To better understand Cranbourne East’s overall crime rate, it is essential to examine its performance in crimes against the person and property crimes separately. This approach can provide further insight into whether violent crimes, property crimes, or both, are the primary drivers of the general crime rate in Cranbourne East.
AU Crime Rate’s analysis of Cranbourne East crime statistics shows that there are 826 incidents against the person per 100,000 inhabitants in a standard year, compared to the Victoria average rate of 1247. As a result, the chances of becoming a victim of crimes such as homicide, assault, dangerous and negligent acts endangering people, robbery, stalking, harassment and threatening behaviour in Cranbourne East are 1 in 120.
Our analysis indicates that if you reside in Cranbourne East, your chances of falling victim to property crimes, including theft, burglary, arson, deception, bribery and damage to property, are 1 in 56, equivalent to a rate of 1746 per 100,000 residents. As a reference, the property crime rate for every 100,000 residents in Victoria is 3580.
Want to understand criminal offences in Victoria and make sense of crime data? Our easy-to-understand crime glossary provides definitions for Victoria’s common criminal offences. Check it out and get the inside scoop on crime in Victoria!
Cranbourne East Crime Rates by Offences Division
Cranbourne East Crimes Against the Person
These are violent crimes against people whether these are family violence or non-family violence. Basically, if someone does something to hurt or scare another person, it’s considered a crime against the person. This includes:
- Assault and related offences: There are different types of assault, like serious assault, which is when someone causes really serious injuries as a result of a physical attack, and assault on police, emergency services or other authorised officers, which is when someone attacks a cop or a paramedic or someone doing their job. There’s also common assault, which is like when someone threatens to punch you or makes you feel scared for your safety.
- Robbery: There are two types of robbery or mugging: aggravated and non-aggravated. Aggravated robbery is when someone uses a weapon like a knife or a firearm (armed robbery) or causes serious harm to the victim during the robbery, like hitting them with a bat or a gun. Non-aggravated robbery is when someone doesn’t use a weapon or cause serious harm during the robbery but still uses force or the threat of force to take something from the victim.
- Dangerous and negligent acts endangering people: These refer to behaviours or actions that put others at risk of harm or injury due to carelessness or recklessness. Examples of dangerous and negligent acts include driving under the influence of drugs or alcohol, not properly securing a load on a vehicle that could fall and cause an accident, leaving hazardous materials unattended, and failing to maintain a property in a safe condition.
- Stalking, harassment and threatening behaviour: This represents harassing or threatening someone based on their race, skin colour, ethnicity, gender, sexual orientation, religion, or disability, in what’s known as hate crimes. It also includes insulting someone, cyberbullying, and cyberstalking.
My Chances of Becoming a Victim of a Crime Against the Person
1 in 120
In Cranbourne East
1 in 78
In Victoria
Crimes Against the Person Comparison (Per 100,000 Residents)
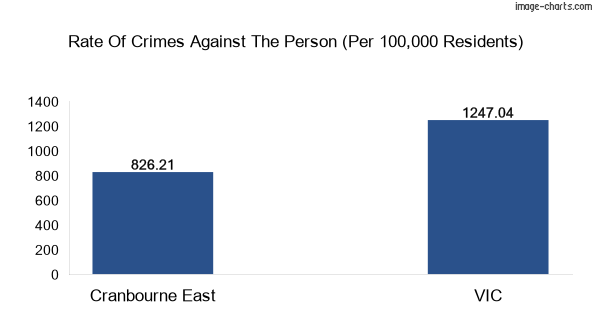
Crimes Against the Person: Cranbourne East vs Victoria
Cranbourne East population: 24691
Victoria population: 6503491
It’s important to note that the crime rates for sexual offences and homicide are not included in the previously mentioned data for Cranbourne East. Here is Victoria’s total data for these offences can be used as a benchmark for comparison.
Cranbourne East Property and Deception Offences
These are crimes related to stealing or damaging property or deceiving someone for personal gain. Property crimes include:
- Theft: It can be committed in various forms such as shoplifting, stealing from a person’s home, or taking a vehicle without permission. Other examples include stealing a bicycle, snatching a purse, or taking items from an unattended bag.
- Burglary (unlawful entry): Aggravated and non-aggravated burglaries are examples of burglary. Aggravated burglary involves the use of weapons, threats, or violence during the break-in, while non-aggravated burglary does not involve such factors.
- Arson: Arson is a criminal act of intentionally setting fire to a property, building, or forest (bushfire) without lawful or justifiable reason.
- Property damage: This refers to intentional or accidental harm caused to someone else’s property, such as vandalism, or graffiti.
- Deception: This is a broad category of offences that includes various examples. These include forgery and counterfeiting, deceptive business practices, professional malpractice and misrepresentation, and other similar offences. Additionally, it includes obtaining benefits by deception, possessing equipment to make a false instrument, and stating false information. All of these crimes involve intentionally deceiving others for personal gain or causing harm to others through fraudulent means.
- Bribery: Sneaky shortcut to get ahead by taking advantage of someone’s position or power.
My Chances of Becoming a Victim of Property and Deception Offences
1 in 56
In Cranbourne East
1 in 27
In Victoria
Property and Deception Offences Comparison (Per 100,000 Residents)
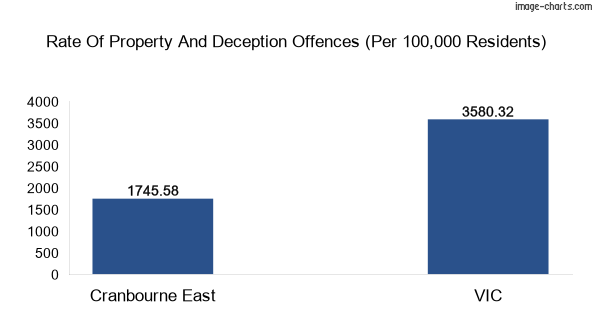
Property and Deception Offences: Cranbourne East vs Victoria, Australia
Cranbourne East population: 24691
Victoria population: 6503491
Here is a breakdown of Cranbourne East crime rate and offences count for the major property and deception offences.
Drug Offences
Drug offences are illegal activities involving drugs like possession, trafficking, and manufacturing. It can involve both illicit and legal drugs like prescription medicines used improperly.
Drug Offences Comparison (Per 100,000 Residents)
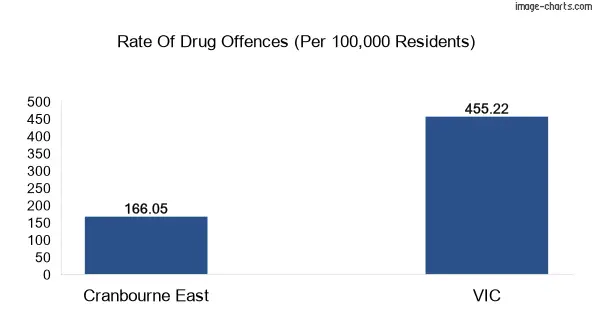
Drug Offences: Cranbourne East vs Victoria
Public Order and Security Offences
Public order and security offences refer to crimes that threaten the safety and security of the community, such as disorderly conduct, possession of illegal weapons, public intoxication, and disturbing the peace. These offences can also include crimes that disrupt the functioning of society, like rioting, protesting without a permit, and obstructing traffic.
Public Order and Security Offences Comparison (Per 100,000 Residents)
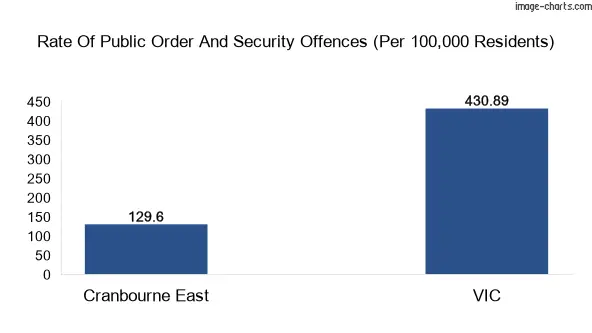
Public Order and Security Offences: Cranbourne East vs Victoria
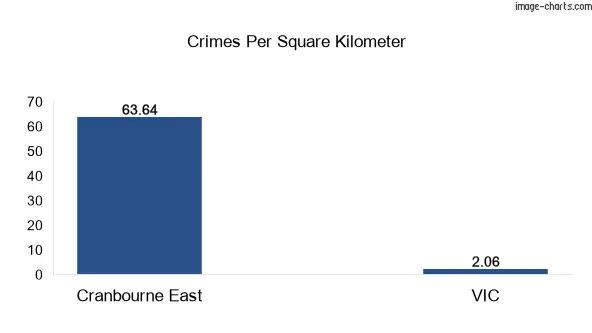
Cranbourne East Crimes per Square KM
What’s the most common crime in Cranbourne East?
According to the latest available data from the Crime Statistics Agency of Victoria (CSA), the most common type of crime in Cranbourne East is steal from a motor vehicle.
What is the crime rate in Cranbourne East?
The overall crime rate in Cranbourne East, as measured by the number of reported offences per 100,000 population was 3418 in the year ending June 2022.
However, it’s important to note that this is an aggregate figure that includes all types of crime, and some types of offences are more prevalent than others. Additionally, crime rates can vary by location, with some areas experiencing higher rates of certain types of crime than others.
Is Cranbourne East a safe place to live in?
Cranbourne East is safer than 64% of suburbs across Australia and the crime rates are below average to the majority of suburbs in Australia. Compared to Victoria suburbs, Cranbourne East is safer than 55% of other suburbs in the state which are considered high safety scores in Victoria.
Total Crime Stats of Cranbourne East
Note: This article doesn’t have detailed data for family violence, victims, female offenders, reoffending, sexual offences, stalking, and youth crime. For more information about these topics, check our resources page.
References
- Crime Statistics Agency (CSA) Victoria
- Australian Bureau of Statistics (ABS) Census QuickStats for all persons
- Victoria Police
Popular Suburbs Near Cranbourne East
Greater Capital City Statistical Area
State