According to Western Australia Police Force (WAPOL), City Beach crime rate for the year ending December 2022 was 6278 incidents per 100,000 population. This represents a 11% decrease from the previous year.
City Beach Crime Index
64
(100 is safest)
Safer than 64% of most Australia suburbs
City Beach Crime Map
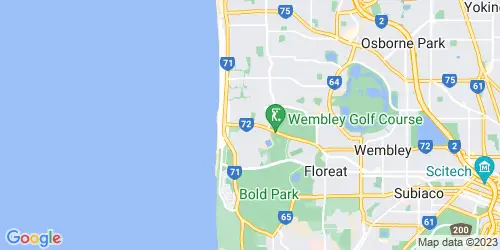
Is City Beach Safe?
City Beach has very high safety metrics. Crime rates in City Beach are below average to the majority of suburbs in Australia. City Beach is safer than 64% of all Australian suburbs and than 81% of Western Australia suburbs. However, stealing is a common offence in City Beach.
City Beach Crime Statistics at a Glance
Has Crime in City Beach increased or decreased in the past 5 years? The chart below shows the 60-month historical trend of the number of offences that occurred in City Beach.
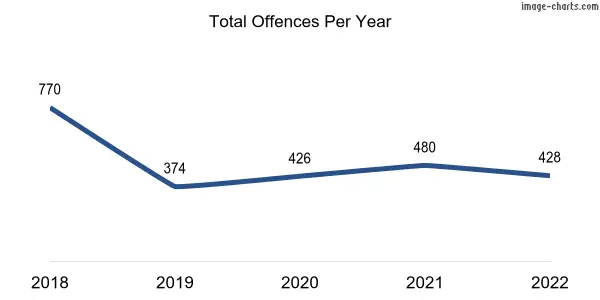
- The number of criminal incidents recorded by Western Australia Police Force in the year 2022 was 428, down 11% from 480 incidents recorded in the same period last year.
- City Beach is in the 81st percentile for safety, meaning 19% of Western Australia suburbs are safer than City Beach and 81% of suburbs are more dangerous than City Beach.
- Common crime: stealing.
- The number of assault offences recorded in 2022 decreased by 48% (11 Incidents) compared to the previous year..
- The number of sexual offences recorded in 2022 decreased by 83% (15 Incidents) compared to the previous year.
- There were no homicide offences recorded during the years 2021 and 2022.
- The number of burglary offences recorded in 2022 decreased by 38% (11 Incidents) compared to the previous year.
- The number of stealing offences recorded in 2022 increased by 16% (13 Incidents) compared to the previous year.
- The number of robbery offences recorded in 2022 decreased by 100% (14 Incidents) compared to the previous year.
- The number of motor vehicle thefts recorded in 2022 increased by 200% (4 Incidents) compared to the previous year.
- The number of property damage offences recorded in 2022 increased by 19% (3 Incidents) compared to the previous year.
Thinking of moving to City Beach?
Experience the ease of moving with Muval, the ‘Uber for removals,’ backed by over 35,000 successful moves. Tap into Australia’s largest network of verified removalists nationwide. Compare prices & reviews, book, and move smoothly with Muval now!
Crime in City Beach: An In-Depth Analysis
AU Crime Rate’s analysis of recent crime data from the Western Australia Police Force (WAPOL) reveals that City Beach’s crime rate is below average to the majority of suburbs in Australia, as it is ranked safer than only 64% of suburbs across the country, irrespective of population size.
Approximately 19% of Western Australia suburbs have a lower crime rate compared to City Beach. Therefore, City Beach’s public safety metrics are generally considered very high.
How risky is that? Living in City Beach comes with a statistical risk of 1 in 43 of becoming a victim of crime, considering the total rate of crimes against the person and property. In contrast, the average chance of falling victim to crime in Western Australia stands at 1 in 13.
To better understand City Beach’s overall crime rate, it is essential to examine its performance in crimes against the person and property crimes separately. This approach can provide further insight into whether violent crimes, property crimes, or both, are the primary drivers of the general crime rate in City Beach.
AU Crime Rate’s analysis of City Beach crime statistics shows that there are 293 incidents against the person per 100,000 inhabitants in a standard year, compared to the Western Australia average rate of 2158. As a result, the chances of becoming a victim of crimes such as homicide, assault, sexual offences, robbery, deprivation of liberty, and threatening behaviour in City Beach are 1 in 340.
Our analysis indicates that if you reside in City Beach, your chances of falling victim to property crimes, including stealing, stealing of motor vehicles, burglary, arson, and property damage, are 1 in 49, equivalent to a rate of 1995 per 100,000 residents. As a reference, the property crime rate for every 100,000 residents in Western Australia is 4822.
City Beach Crime Rates by Offences Division
| Division | Number of Crimes | Crime Rate (Per 100,000 Residents) |
|---|---|---|
| Offences against the person | 20 | 293 |
| Offences against Property | 136 | 1995 |
| Other Offences | 272 | 3990 |
| Total | 428 | 6278 |
City Beach Crimes Against the Person
These are violent crimes against people whether these are family violence or non-family violence. Basically, if someone does something to hurt or scare another person, it’s considered a crime against the person. This includes:
- Assault and related offences: There are different types of assault, like serious assault, which is when someone causes severe injuries as a result of a physical attack, and assault on police, emergency services, or other authorised officers, which is when someone attacks a cop or a paramedic or someone doing their job. There’s also common assault, which is like when someone threatens to punch you or makes you feel scared for your safety.
- Robbery: There are two types of robbery or mugging: aggravated and non-aggravated. Aggravated robbery is when someone uses a weapon like a knife or a firearm (armed robbery) or causes serious harm to the victim during the robbery, like hitting them with a bat or a gun. Non-aggravated robbery is when someone doesn’t use a weapon or cause serious harm during the robbery but still uses force or the threat of force to take something from the victim.
- Deprivation of Liberty: This offence typically involves unlawfully detaining or confining another person against their will. The essence of this offence is the intentional restriction of a person’s freedom of movement without lawful excuse or their consent.
- Threatening behaviour: This represents harassing or threatening someone based on their race, skin colour, ethnicity, gender, sexual orientation, religion, or disability, in what’s known as hate crimes. It also includes insulting someone, cyberbullying, and cyberstalking.
My Chances of Becoming a Victim of a Crime Against the Person
1 in 340
In City Beach
1 in 45
In Western Australia
Crimes Against the Person Comparison (Per 100,000 Residents)
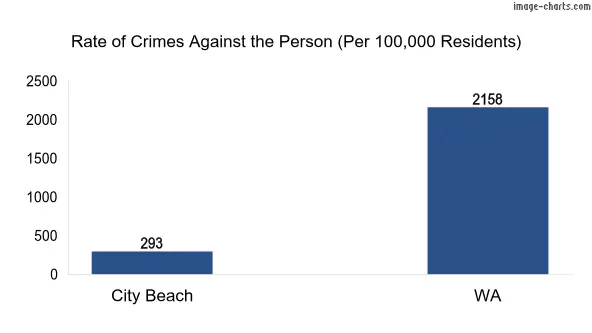
Crimes Against the Person: City Beach vs Western Australia
City Beach population: 6817
Western Australia population: 2660026
| Crimes | Total Criminal Incidents | WA Total Criminal Incidents | Crime Rate (Per 100,000 Residents) | WA Crime Rate (per 100,000 residents) |
|---|---|---|---|---|
| Homicide | 0 | 85 | 0 | 3 |
| Assault | 12 | 40758 | 176 | 1532 |
| Sexual offences | 3 | 6342 | 44 | 238 |
| Robbery | 0 | 1507 | 0 | 57 |
| Deprivation of Liberty | 1 | 252 | 15 | 9 |
| Threatening Behaviour | 4 | 8463 | 59 | 318 |
City Beach Against Property offences
These are crimes related to stealing or damaging property or deceiving someone for personal gain. Property crimes include:
- Stealing: It can be committed in various forms such as shoplifting, stealing from a person’s home, or taking a vehicle without permission. Other examples include stealing a bicycle, snatching a purse, or taking items from an unattended bag.
- Burglary (unlawful entry): Aggravated and non-aggravated burglaries are examples of burglary. Aggravated burglary involves the use of weapons, threats, or violence during the break-in, while non-aggravated burglary does not involve such factors.
- Arson: Arson is a criminal act of intentionally setting fire to a property, building, or forest (bushfire) without lawful or justifiable reason.
- Property damage: This refers to intentional or accidental harm caused to someone else’s property, such as vandalism, or graffiti.
My Chances of Becoming a Victim of Against Property offences
1 in 49
In City Beach
1 in 20
In Western Australia
Crimes Against Property Comparison (Per 100,000 Residents)
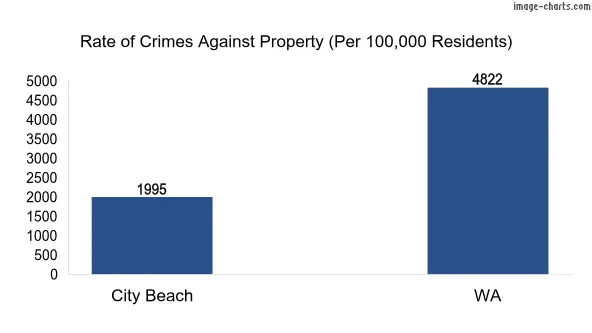
Against Property offences: City Beach vs Western Australia
City Beach population: 6817
Western Australia population: 2660026
| Crimes | Total Criminal Incidents | WA Total Criminal Incidents | Crime Rate (Per 100,000 Residents) | WA Crime Rate (per 100,000 residents) |
|---|---|---|---|---|
| Stealing | 92 | 72011 | 1350 | 2707 |
| Stealing of Motor Vehicles | 6 | 6391 | 88 | 240 |
| Burglary/Break and enter | 18 | 22051 | 264 | 829 |
| Arson | 1 | 956 | 15 | 36 |
| Property Damage | 19 | 26856 | 279 | 1010 |
Other Offences
The category of other offences encompasses a range of unlawful activities such as drug-related violations, graffiti vandalism, various forms of fraud and related deceptive practices, as well as contraventions of Violence Restraining Orders. These offences, while distinct in nature, all fall under the broader umbrella of criminal activities that are subject to legal penalties.
Other Offences Comparison (Per 100,000 Residents)
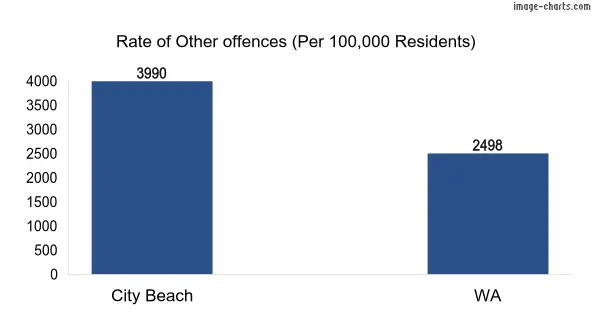
Other Offences: City Beach vs Western Australia
| Crimes | Total Criminal Incidents | WA Total Criminal Incidents | Crime Rate (Per 100,000 Residents) | WA Crime Rate (per 100,000 residents) |
|---|---|---|---|---|
| Drug Offences | 10 | 20651 | 147 | 776 |
| Graffiti | 1 | 2017 | 15 | 76 |
| Fraud & Related Offences | 45 | 31229 | 660 | 1174 |
| Breach of Violence Restraint Order | 2 | 12556 | 29 | 472 |
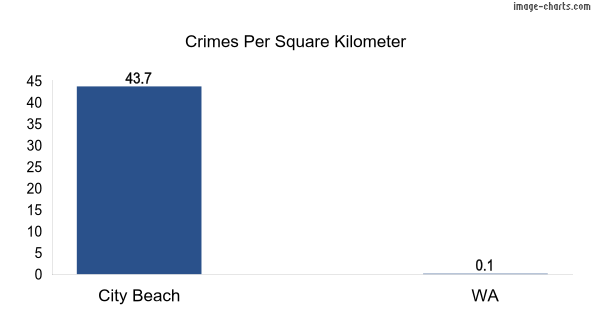
City Beach Crimes per Square KM
How many murders in City Beach in 2022?
According to Western Australia Police Force (WAPOL), there were 0 homicides in City Beach in 2022. It’s important to note that this figure includes all homicides, not just murders.
What’s the most common crime in City Beach?
According to the latest available data from Western Australia Police Force (WAPOL), the most common type of crime in City Beach is stealing.
What is the crime rate in City Beach?
The overall crime rate in City Beach, as measured by the number of reported offences per 100,000 population was 6278 in the year ending December 2022.
However, it’s important to note that this is an aggregate figure that includes all types of crime, and some types of offences are more prevalent than others. Additionally, crime rates can vary by location, with some areas experiencing higher rates of certain types of crime than others.
Is City Beach a safe place to live in?
City Beach is safer than 64% of suburbs across Australia and the crime rates are below average to the majority of suburbs in Australia. Compared to Western Australia suburbs, City Beach is safer than 81% of other suburbs in the state which are considered very high safety scores in Western Australia.
Total Crime Stats of City Beach
| Division | Subdivision | Year (2021) | Year (2022) |
|---|---|---|---|
| Against The Person | Homicide | 0 | 0 |
| Against The Person | Sexual Offences | 18 | 3 |
| Against The Person | Assault (Family) | 18 | 10 |
| Against The Person | Assault (Non-Family) | 5 | 2 |
| Against The Person | Threatening Behaviour (Family) | 3 | 1 |
| Against The Person | Threatening Behaviour (Non-Family) | 4 | 3 |
| Against The Person | Deprivation of Liberty | 0 | 1 |
| Against The Person | Robbery | 14 | 0 |
| Aganst Property | Dwelling Burglary | 25 | 14 |
| Aganst Property | Non-Dwelling Burglary | 4 | 4 |
| Aganst Property | Stealing of Motor Vehicle | 2 | 6 |
| Aganst Property | Stealing | 79 | 92 |
| Aganst Property | Property Damage | 16 | 19 |
| Aganst Property | Arson | 0 | 1 |
| Other Offences | Drug Offences | 24 | 10 |
| Other Offences | Graffiti | 1 | 1 |
| Other Offences | Fraud & Related Offences | 24 | 45 |
| Other Offences | Breach of Violence Restraint Order | 3 | 2 |
Note: This article doesn’t have detailed data for family violence, victims, female offenders, reoffending, stalking, and youth crime. For more information about these topics, check our resources page.
References
- Western Australia Police Force (WAPOL)
- Australian Bureau of Statistics (ABS) Census QuickStats for all persons
Popular Suburbs Near City Beach
Greater Capital City Statistical Area
State