According to South Australia Police (SAPOL), Plympton Park crime rate for the year ending December 2022 was 5409 incidents per 100,000 population. This represents a 11% increase from the previous year.
Plympton Park Crime Index
33
(100 is safest)
Safer than 33% of most Australia suburbs
Plympton Park Crime Map
Is Plympton Park Safe?
Plympton Park has moderate safety metrics. Crime rates in Plympton Park are quite a bit higher than average regarding to most Australian suburbs. Plympton Park is safer than 33% of all Australian suburbs and than 27% of South Australia suburbs. However, Theft from motor vehicle is a common offence in Plympton Park.
Plympton Park Crime Statistics at a Glance
Has Crime in Plympton Park increased or decreased in the past 5 years? The chart below shows the 60-month historical trend of the number of offences that occurred in Plympton Park.
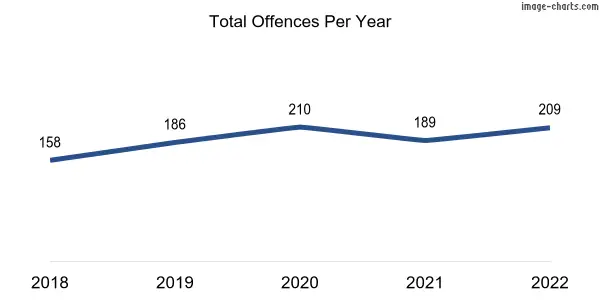
- The number of criminal incidents recorded by South Australia Police in the year 2022 was 209, up 11% from 189 incidents recorded in the same period last year.
- Plympton Park is in the 27th percentile for safety, meaning 73% of South Australia suburbs are safer than Plympton Park and 27% of suburbs are more dangerous than Plympton Park.
- Common crime: Theft from motor vehicle.
- The number of assault offences recorded in 2022 decreased by 16% (6 Incidents) compared to the previous year..
- There were no homicide offences recorded during the years 2021 and 2022.
- The number of burglary offences recorded in 2022 increased by 7% (2 Incidents) compared to the previous year.
- The number of theft offences recorded in 2022 increased by 48% (27 Incidents) compared to the previous year.
- There were no robbery offences recorded during the years 2021 and 2022.
- The number of motor vehicle thefts recorded in 2022 increased by 67% (2 Incidents) compared to the previous year.
- The number of vandalism offences (Property damage) recorded in 2022 decreased by 7% (4 Incidents) compared to the previous year.
Thinking of moving to Plympton Park?
Experience the ease of moving with Muval, the ‘Uber for removals,’ backed by over 35,000 successful moves. Tap into Australia’s largest network of verified removalists nationwide. Compare prices & reviews, book, and move smoothly with Muval now!
Crime in Plympton Park: An In-Depth Analysis
Based on the latest crime statistics from the South Australia Police (SAPOL), the AU Crime Rate’s analysis indicates that Plympton Park is safer than only 33% of all suburbs across the nation, regardless of population size. This implies that Plympton Park’s crime rate is quite a bit higher than average regarding to most Australian suburbs.
How does Plympton Park perform compared to other suburbs of all population sizes in South Australia? The crime rate in Plympton Park is greater than that of roughly 73% of other suburbs in South Australia, leading to moderate public safety scores.
As a resident of Plympton Park, the likelihood of becoming a victim of crime is 1 in 17 based on the combined crime rate of offences against the person and property. This is in contrast to South Australian average, where the chance of becoming a victim of crime is 1 in 16.
To get a more comprehensive understanding of Plympton Park’s crime statistics, it is essential to take a closer look at its against the person and property crime data. This examination is particularly critical because it enables us to determine whether violent crime, property crime, or both are the primary contributors to the total crime rate in Plympton Park. By doing so, we can gain a more in-depth insight into the nature and extent of crime in Plympton Park.
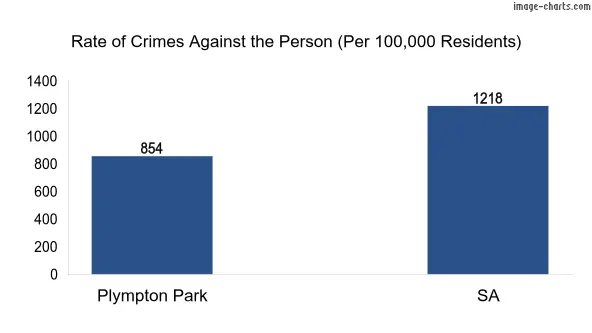
AU Crime Rate’s analysis has uncovered that the rate of crimes against the person in Plympton Park is 854 per one hundred thousand inhabitants. By contrast, the statewide average for such crimes stands at 1218. This suggests that experiencing serious offences like homicide, acts intended to cause injury, robbery, and other offences against the person is 1 in 116 if you reside in Plympton Park.
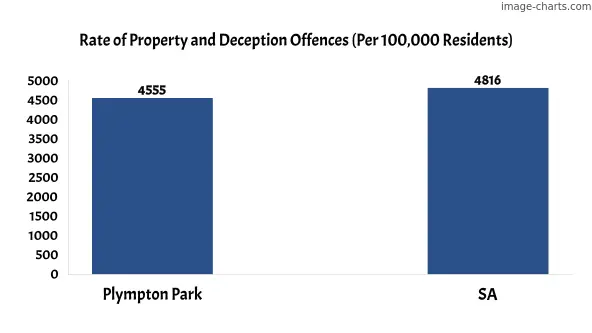
Our data reveal that the odds of becoming a victim of property crime in Plympton Park are 1 in 21, with a rate of 4555 incidents per 100,000 residents. Keep in mind that the South Australia average is 4816 incidents per 100,000 residents. The types of property crimes tracked in this analysis include theft, fraud, property damage, and serious criminal trespass.
Plympton Park Crime Rates by Offences Division
| Division | Number of Crimes | Crime Rate (Per 100,000 Residents) |
|---|---|---|
| Offences against the person | 33 | 854 |
| Property and deception offences | 176 | 4555 |
| Total | 209 | 5409 |
Note: The only crime data that SAPOL presents is Property and person crimes. So you shouldn’t compare the crime rates of suburbs or urban areas with any other areas in another state in Australia.
Plympton Park Crimes Against the Person (Violent crimes)
These are violent crimes against people whether these are family violence or non-family violence. Basically, if someone does something to hurt or scare another person, it’s considered a crime against the person. This includes:
- “Acts Intended to Cause Injury” is a legal category that includes different types of crimes where someone intentionally tries to harm another person. There are subcategories within this, including:
- Assault Police: When someone intentionally attacks a police officer while they’re doing their job.
- Common Assault: This involves deliberately using force or threats to make someone fear they’ll be hurt. It doesn’t necessarily result in serious injuries.
- Serious Assault Resulting in Injury: This is when someone intentionally harms another person, causing them significant injuries.
- Serious Assault Not Resulting in Injury: Even if serious harm doesn’t happen, if someone tries to cause it intentionally, it can still be a crime.
- Homicide and Related offences: These are categories of crimes related to taking someone’s life:
- Murder: This is the most serious type of crime where someone intentionally kills another person.
- Other Homicide and Related offences: This category includes various other crimes connected to causing death. These might involve different levels of intent or circumstances, like manslaughter or offences related to causing death through negligence or recklessness.
- Robbery and related offences: These are the categories of crimes related to robbery:
- Non-Aggravated Robbery: This is a type of theft where someone takes property from another person using force or threats, but it doesn’t involve additional serious factors.
- Blackmail and Extortion: These offences involve forcing someone to give you money or property by using threats or information against them. Blackmail is when you threaten to reveal embarrassing or damaging information, while extortion includes broader threats of harm or force.
- Aggravated Robbery: This is a more severe form of robbery. It happens when someone uses weapons or inflicts serious harm or injury during the robbery. These factors make the crime even more serious and result in harsher penalties.
My Chances of Becoming a Victim of a Crime Against the Person
1 in 116
In Plympton Park
1 in 81
In South Australia
Crimes Against the Person Comparison (Per 100,000 Residents)
Crimes Against the Person: Plympton Park vs South Australia
Plympton Park population: 3864
South Australia population: 1777698
| Crimes | Total Criminal Incidents | SA Total Criminal Incidents | Crime Rate (Per 100,000 Residents) | SA Crime Rate (per 100,000 residents) |
|---|---|---|---|---|
| Homicide | 0 | 41 | 0 | 2 |
| Acts intended to cause injury (Assault) | 31 | 19651 | 802 | 1105 |
| Robbery | 0 | 625 | 0 | 35 |
| Abduction, harassment and other offences | 2 | 419 | 52 | 24 |
| Blackmail and extortion | 0 | 93 | 0 | 5 |
| Other offences against the person | 2 | 1334 | 52 | 75 |
Here is a breakdown of the major Crimes against the person
| Crimes | No, of offences | Rate |
|---|---|---|
| Common Assault | 6 | 155 |
| Serious Assault resulting in injury | 5 | 129 |
| Serious Assault not resulting in injury | 20 | 518 |
Note: The data on sexual assault and related crimes is only available for the entire state of South Australia and not broken down by specific suburbs or urban areas. We have provided state-level statistics for your reference.
| Crimes | SA offences count | SA rate (per 100,000 residents) |
|---|---|---|
| Aggravated sexual assault | 1294 | 73 |
| Non-aggravated sexual assault | 435 | 24 |
| Non-assaultive sexual offences | 394 | 22 |
| Total Sexual assault and related offences | 2123 | 119 |
Plympton Park Offences Against Property
These are crimes related to stealing or damaging property or deceiving someone for personal gain. Property crimes include:
- Property damage and environmental offences: These are categories of crimes related to damaging property and environmental violations:
- Other Property Damage and Environmental: This is a broad category covering various offences related to damaging property or breaking environmental rules. It includes different types of related crimes not mentioned elsewhere.
- Graffiti: Graffiti involves illegally drawing or writing on buildings or walls without permission, which damages property and is against the law.
- Property Damage by Fire or Explosion (Arson): Arson is when someone intentionally sets fire to property, causing damage or destruction. This category focuses on property damage caused specifically by fire or explosions, often with criminal intent.
- Serious criminal trespass: These categories are related to serious criminal trespass, commonly referred to as burglary, and other unlawful entries with different intents:
- Other Unlawful Entry with Intent: This covers various unauthorized entries into different places where the purpose may not fit into the categories below.
- Unlawful Entry – Non-Residence: This is when someone breaks into a non-residential place, like a store or office, with the intention to commit a crime, like theft or vandalism. It’s not about homes.
- Unlawful Entry – Residence: This is about unlawfully entering someone’s home with criminal intent, like to steal or harm. It’s specifically about intrusions into houses.
- Theft: It can be committed in various forms such as shoplifting, stealing from a person’s home, or taking a vehicle without permission. Other examples include stealing a bicycle, snatching a purse, or taking items from an unattended bag.
- Fraud, Deception, and Related offences: These are categories of crimes related to fraud and deception in South Australia:
- Other Fraud, Deception, and Related offences: This covers various types of fraudulent and deceptive activities that don’t fit into specific subcategories. It’s a broad category.
- Obtain Benefit by Deception: This offence involves deceiving someone to gain an advantage or benefit that you aren’t entitled to. It means obtaining something unfairly through trickery or dishonesty.
My Chances of Becoming a Victim of Offences Against Property
1 in 21
In Plympton Park
1 in 20
In South Australia
Offences Against Property Comparison (Per 100,000 Residents)
Against Property offences: Plympton Park vs South Australia
Plympton Park population: 3864
South Australia population: 1777698
| Crimes | Total Criminal Incidents | SA Total Criminal Incidents | Suburb Crime Rate (per 100,000 residents) | SA Crime Rate (per 100,000 residents) |
|---|---|---|---|---|
| Theft and related offences | 83 | 85784 | 2148 | 1640 |
| Serious criminal trespass (burglary) | 32 | 12477 | 828 | 702 |
| Fraud, deception and related offences | 10 | 4391 | 259 | 247 |
| Property damage and environmental | 51 | 20997 | 1320 | 1181 |
Here is a breakdown of Plympton Park crime rate and offences count for the major property and deception offences.
| Crimes | No, of offences | Rate |
|---|---|---|
| Theft/Illegal use of motor vehicle | 5 | 129 |
| Theft from motor vehicle | 35 | 906 |
| Theft from shop | 0 | 0 |
| Property damage by fire or explosion (Arson) | 2 | 52 |
| Unlawful entry - Residence | 14 | 362 |
| Unlawful entry - Non Residence | 12 | 311 |
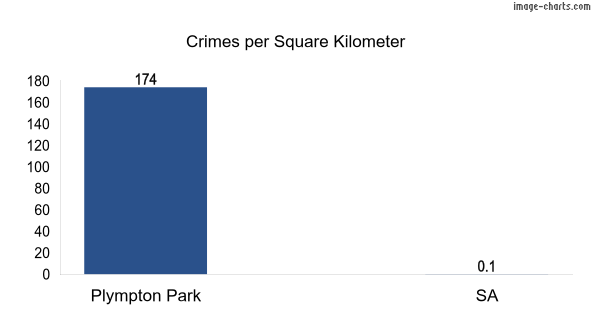
Plympton Park Crimes per Square KM
How many murders in Plympton Park in 2022?
According to South Australia Police (SAPOL), there were 0 murders in Plympton Park in 2022. The number of homicides (which includes murders and other related offences) was 0.
What’s the most common crime in Plympton Park?
According to the latest available data from South Australia Police (SAPOL), the most common type of crime in Plympton Park is Theft from motor vehicle.
What is the crime rate in Plympton Park?
The overall crime rate in Plympton Park, as measured by the number of reported offences per 100,000 population was 5409 in the year ending December 2022.
However, it’s important to note that this is an aggregate figure that includes all types of crime, and some types of offences are more prevalent than others. Additionally, crime rates can vary by location, with some areas experiencing higher rates of certain types of crime than others.
Is Plympton Park a safe place to live in?
Plympton Park is safer than 33% of suburbs across Australia and the crime rates are quite a bit higher than average regarding to most Australian suburbs. Compared to South Australia suburbs, Plympton Park is safer than 27% of other suburbs in the state which are considered moderate safety scores in South Australia.
Total Crime Stats of Plympton Park
| Division | Subdivision | Offence type | Year (2021) | Year (2022) |
|---|---|---|---|---|
| OFFENCES AGAINST THE PERSON | ACTS INTENDED TO CAUSE INJURY | Other acts intended to cause injury | 6 | 0 |
| OFFENCES AGAINST THE PERSON | OTHER OFFENCES AGAINST THE PERSON | Abduction, harassment and other offences | 2 | 2 |
| OFFENCES AGAINST THE PERSON | OTHER OFFENCES AGAINST THE PERSON | Threatening behaviour | 2 | 0 |
| OFFENCES AGAINST THE PERSON | HOMICIDE AND RELATED OFFENCES | Murder | 0 | 0 |
| OFFENCES AGAINST THE PERSON | SEXUAL ASSAULT AND RELATED OFFENCES | Aggravated sexual assault | 0 | 0 |
| OFFENCES AGAINST THE PERSON | SEXUAL ASSAULT AND RELATED OFFENCES | Non-aggravated sexual assault | 0 | 0 |
| OFFENCES AGAINST THE PERSON | ROBBERY AND RELATED OFFENCES | Non-aggravated robbery | 0 | 0 |
| OFFENCES AGAINST THE PERSON | HOMICIDE AND RELATED OFFENCES | Other homicide and related offences | 0 | 0 |
| OFFENCES AGAINST THE PERSON | ROBBERY AND RELATED OFFENCES | Blackmail and extortion | 0 | 0 |
| OFFENCES AGAINST THE PERSON | ACTS INTENDED TO CAUSE INJURY | Assault police | 0 | 0 |
| OFFENCES AGAINST THE PERSON | SEXUAL ASSAULT AND RELATED OFFENCES | Non-assaultive sexual offences | 0 | 0 |
| OFFENCES AGAINST THE PERSON | ROBBERY AND RELATED OFFENCES | Aggravated robbery | 0 | 0 |
| OFFENCES AGAINST THE PERSON | ACTS INTENDED TO CAUSE INJURY | Common Assault | 5 | 6 |
| OFFENCES AGAINST THE PERSON | ACTS INTENDED TO CAUSE INJURY | Serious Assault resulting in injury | 7 | 5 |
| OFFENCES AGAINST THE PERSON | OTHER OFFENCES AGAINST THE PERSON | Dangerous or negligent acts | 0 | 0 |
| OFFENCES AGAINST THE PERSON | ACTS INTENDED TO CAUSE INJURY | Serious Assault not resulting in injury | 19 | 20 |
| OFFENCES AGAINST PROPERTY | THEFT AND RELATED OFFENCES | Other theft | 27 | 40 |
| OFFENCES AGAINST PROPERTY | THEFT AND RELATED OFFENCES | Theft from shop | 3 | 0 |
| OFFENCES AGAINST PROPERTY | FRAUD DECEPTION AND RELATED OFFENCES | Other fraud, deception and related offences | 3 | 3 |
| OFFENCES AGAINST PROPERTY | PROPERTY DAMAGE AND ENVIRONMENTAL | Other property damage and environmental | 38 | 48 |
| OFFENCES AGAINST PROPERTY | THEFT AND RELATED OFFENCES | Theft from motor vehicle | 22 | 35 |
| OFFENCES AGAINST PROPERTY | THEFT AND RELATED OFFENCES | Receive or handle proceeds of crime | 1 | 3 |
| OFFENCES AGAINST PROPERTY | SERIOUS CRIMINAL TRESPASS (burglary) | Other unlawful entry with intent | 3 | 6 |
| OFFENCES AGAINST PROPERTY | FRAUD DECEPTION AND RELATED OFFENCES | Obtain benefit by deception | 4 | 7 |
| OFFENCES AGAINST PROPERTY | SERIOUS CRIMINAL TRESPASS (burglary) | Unlawful entry - Non Residence | 8 | 12 |
| OFFENCES AGAINST PROPERTY | THEFT AND RELATED OFFENCES | Theft/Illegal use of motor vehicle | 3 | 5 |
| OFFENCES AGAINST PROPERTY | PROPERTY DAMAGE AND ENVIRONMENTAL | Graffiti | 16 | 1 |
| OFFENCES AGAINST PROPERTY | SERIOUS CRIMINAL TRESPASS (burglary) | Unlawful entry - Residence | 19 | 14 |
| OFFENCES AGAINST PROPERTY | PROPERTY DAMAGE AND ENVIRONMENTAL | Property damage by fire or explosion (Arson) | 1 | 2 |
Note: This article doesn’t have detailed data for family violence, victims, female offenders, reoffending, sexual offences, stalking, and youth crime. For more information about these topics, check our resources page.
References
- South Australia Police (SAPOL)
- South Australia Government Data Directory
Popular Suburbs Near Plympton Park
Greater Capital City Statistical Area
State