According to Queensland Police Service (QPS), Pierces Creek crime rate for the year ending June 2022 was 2105 incidents per 100,000 population. This represents a 50% decrease from the previous year.
Pierces Creek Crime Index
100
(100 is safest)
Safer than 100% of most Australia suburbs
Pierces Creek Crime Map
Is Pierces Creek Safe?
Pierces Creek has very high safety metrics. Crime rates in Pierces Creek are noticeably lower than the average compared to most Australia’s suburbs. Pierces Creek is safer than 100% of all Australian suburbs and than 75% of Queensland suburbs. However, unlawful use of motor vehicle is a common offence in Pierces Creek.
Pierces Creek Crime Statistics at a Glance
Has Crime in Pierces Creek increased or decreased in the past 5 years? The chart below shows the 60-month historical trend of the number of offences that occurred in Pierces Creek.
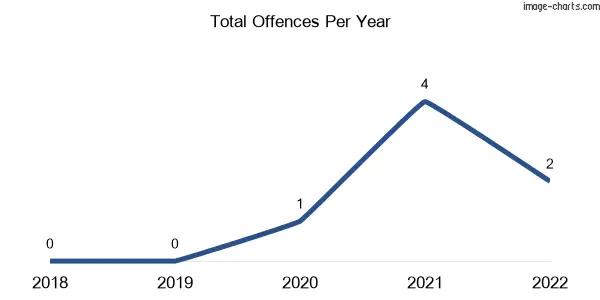
- The number of criminal incidents recorded in the year 2022 was 2, down 50% from 4 incidents recorded in the same period last year.
- Pierces Creek is in the 75th percentile for safety, meaning 25% of Queensland suburbs are safer than Pierces Creek and 75% of suburbs are more dangerous than Pierces Creek.
- Street safety to walk at night: fairly safe.
- Common crime: unlawful use of motor vehicle.
- There were no assault offences recorded during the years 2021 and 2022.
- There were no murder offences recorded during the years 2021 and 2022.
- The number of unlawful entry offences recorded in 2022 increased by 100% (1 Incidents) compared to the previous year.
- There were no theft offences (excl. Unlawful Entry) recorded during the years 2021 and 2022.
- There were no robbery offences recorded during the years 2021 and 2022.
- The number of unlawful use of motor vehicles (car theft) recorded in 2022 increased by 100% (1 Incidents) compared to the previous year.
- There were no vandalism offences (other property damage) recorded during the years 2021 and 2022.
Thinking of moving to Pierces Creek?
Experience the ease of moving with Muval, the ‘Uber for removals,’ backed by over 35,000 successful moves. Tap into Australia’s largest network of verified removalists nationwide. Compare prices & reviews, book, and move smoothly with Muval now!
Crime in Pierces Creek: An In-Depth Analysis
Based on the latest crime statistics from the Queensland Police Service (QPS), AU Crime Rate’s analysis indicates that Pierces Creek is safer than only 100% of all suburbs across the nation, regardless of population size. This implies that Pierces Creek’s crime rate is noticeably lower than the average compared to most Australia’s suburbs.
How does Pierces Creek perform compared to other suburbs of all population sizes in Queensland? The crime rate in Pierces Creek is greater than that of roughly 25% of other suburbs in Queensland, leading to very high public safety scores.
As a resident of Pierces Creek, the likelihood of becoming a victim of crime is 1 in 46 based on the combined crime rate of offences against the person and property. This is in contrast to the Queensland average, where the chance of becoming a victim of crime is 1 in 16.
To get a more comprehensive understanding of Pierces Creek’s crime statistics, it is essential to take a closer look at its against the person and property crime data. This examination is particularly critical because it enables us to determine whether violent crime, property crime, or both are the primary contributors to the total crime rate in Pierces Creek. By doing so, we can gain a more in-depth insight into the nature and extent of crime in Pierces Creek.
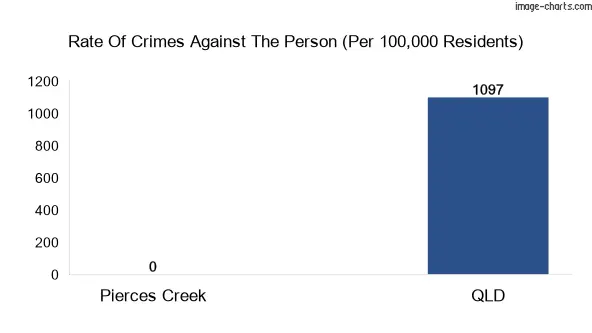
AU Crime Rate’s analysis has uncovered that the rate of crimes against the person in Pierces Creek is 0 per one hundred thousand inhabitants. By contrast, the statewide average for such crimes stands at 1097. This suggests that experiencing serious offences like homicide, assault, robbery and other offences against the person is 0 if you reside in Pierces Creek.
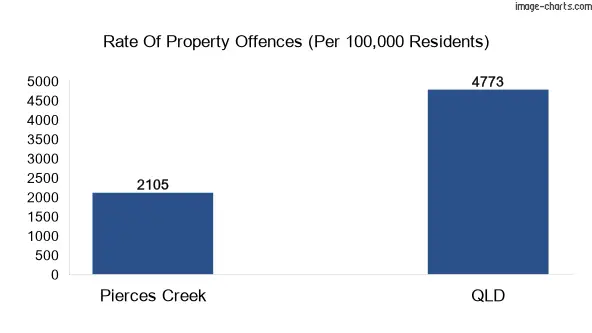
Our data reveal that the odds of becoming a victim of property crime in Pierces Creek are 1 in 47, with a rate of 2105 incidents per 100,000 residents. Keep in mind that the Queensland average is 4773 incidents per 100,000 residents. The types of property crimes tracked in this analysis include arson, fraud, handling stolen goods, unlawful entry, unlawful use of motor vehicles, other theft, and other property damage.
Pierces Creek Crime Rates by Offences Division
| Division | Number of Crimes | Crime Rate (Per 100,000 Residents) |
|---|---|---|
| Crimes against the person | 0 | 0 |
| Property and deception offences | 2 | 2105 |
| Other offences | 0 | 0 |
| Total | 2 | 2105 |
Pierces Creek Crimes Against the Person (Violent Crimes)
These are violent crimes against people whether these are family violence or non-family violence. Basically, if someone does something to hurt or scare another person, it’s considered a crime against the person. This includes:
- Other Homicide: Other homicides are crimes that include attempted murder, murder conspiracy, and manslaughter. Attempted murder is when someone tries to kill another person but is unsuccessful. Murder conspiracy is when two or more people plan to kill someone. Manslaughter is when someone unintentionally causes the death of another person.
- Assault and related offences: There are different types of assault, like serious assault, which is when someone causes really serious injuries as a result of a physical attack, and assault on police, emergency services or other authorised officers, which is when someone attacks a cop or a paramedic or someone doing their job. There’s also common assault, which is like when someone threatens to punch you or makes you feel scared for your safety.
- Robbery: There are two types of robbery or mugging: aggravated and non-aggravated. Aggravated robbery is when someone uses a weapon like a knife or a firearm (armed robbery) or causes serious harm to the victim during the robbery, like hitting them with a bat or a gun. Non-aggravated robbery is when someone doesn’t use a weapon or cause serious harm during the robbery but still uses force or the threat of force to take something from the victim.
- Other offences against the person: These include going armed to cause fear, threatening violence, deprivation of liberty, stalking, and torture. Going Armed to Cause Fear is when someone carries a weapon with the intention of making others scared. Threatening Violence is when someone uses words or actions to scare or intimidate someone else. Deprivation of Liberty is when someone is held against their will, and Stalking is when someone repeatedly follows or harasses another person. Finally, Torture is when someone intentionally hurts someone else very badly, usually to make them suffer or to get information.
My Chances of Becoming a Victim of a Crime Against the Person
0
In Pierces Creek
1 in 90
In Queensland
Crimes Against the Person Comparison (Per 100,000 Residents)
Crimes Against the Person: Pierces Creek vs Queensland
Pierces Creek population: 95
Queensland population: 5156138
| Crimes | Total Criminal Incidents | QLD Total Criminal Incidents | Crime Rate (Per 100,000 Residents) | QLD Crime Rate (per 100,000 residents) |
|---|---|---|---|---|
| Robbery | 0 | 2354 | 0 | 46 |
| Other offences against the person | 0 | 7156 | 0 | 139 |
| Homicide (Murder) | 0 | 45 | 0 | 0.87 |
| Other Homicide | 0 | 66 | 0 | 1.3 |
| Assault | 0 | 46940 | 0 | 910 |
It’s important to note that the crime rates for sexual offences are not included in the previously mentioned data for Pierces Creek. Here is Toowoomba local government area (LGA) data for these offences that can be used as a benchmark for comparison.
| Crimes | Total Criminal Incidents | QLD Total Criminal Incidents | Crime Rate (Per 100,000 Residents) | QLD Crime Rate (per 100,000 residents) |
|---|---|---|---|---|
| Rape and Attempted Rape | 203 | 2824 | 109 | 55 |
| Other Sexual Offences | 225 | 4771 | 117 | 93 |
| Sexual Offences (Total) | 428 | 7595 | 226 | 147 |
Pierces Creek Offences Against Property
These are crimes related to stealing or damaging property or deceiving someone for personal gain. Property crimes include:
- Theft: It can be committed in various forms such as shoplifting, stealing from a person’s home, or taking a vehicle without permission. Other examples include stealing a bicycle, snatching a purse, or taking items from an unattended bag.
- Unlawful entry (burglary): Aggravated and non-aggravated burglaries are examples of burglary. Aggravated burglary involves the use of weapons, threats, or violence during the break-in, while non-aggravated burglary does not involve such factors.
- Unlawful Use of Motor Vehicle: Unlawful Use of Motor Vehicle is when someone uses/steals a car, a bicycle, or other vehicle without the owner’s permission or without legal authority.
- Arson: Arson is a criminal act of intentionally setting fire to a property, building, or forest (bushfire) without lawful or justifiable reason.
- Handling Stolen Goods: Handling Stolen Goods is a criminal offence that involves dealing with property that has been stolen. For instance, if someone buys a bike from a person they know stole it, they are committing the crime of Handling Stolen Goods. Similarly, if someone sells a stolen phone to someone else, they are also committing the crime. Even if someone receives a stolen item as a gift or in good faith, they can still be charged with the offence if they knew or ought to have known that the property was stolen.
- Fraud: Fraud is a type of criminal activity that involves deceiving or misleading someone for personal gain. Examples of fraud include things like pretending to be someone else to access their bank account, selling fake products or services, or making false insurance claims.
- Property damage: This refers to intentional or accidental harm caused to someone else’s property, such as vandalism, or graffiti.
My Chances of Becoming a Victim of Offences Against Property
1 in 47
In Pierces Creek
1 in 20
In Queensland
Offences Against Property Comparison (Per 100,000 Residents)
Against Property offences: Pierces Creek vs Queensland, Australia
Pierces Creek population: 95
Queensland population: 5156138
| Crimes | Total Criminal Incidents | QLD Total Criminal Incidents | Crime Rate (Per 100,000 Residents) | QLD Crime Rate (per 100,000 residents) |
|---|---|---|---|---|
| Other Theft (excl. Unlawful Entry) | 0 | 123201 | 0 | 2389 |
| Unlawful Entry | 1 | 46783 | 1053 | 907 |
| Unlawful Use of Motor Vehicle | 1 | 18092 | 1053 | 351 |
| Arson | 0 | 1252 | 0 | 24 |
| Handling Stolen Goods | 0 | 5153 | 0 | 100 |
| Fraud | 0 | 14329 | 0 | 278 |
| Other Property Damage | 0 | 37309 | 0 | 724 |
Other Offences
Other Offences is a group of crimes that covers many areas, including drugs, prostitution, gambling, and traffic. This includes drug crimes, prostitution, selling alcohol without permission, gambling and racing offences, breaking domestic violence protection orders, trespassing and vagrancy, weapon crimes, disorderly conduct, stock-related crimes, traffic violations, and other miscellaneous crimes.
Other Offences Comparison (Per 100,000 Residents)
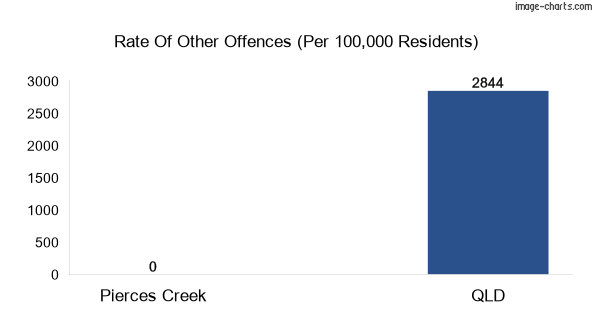
Other Offences: Pierces Creek vs Queensland
Here is a breakdown of some of the other offences that we mentioned before.
| Crimes | Total Criminal Incidents | QLD Total Criminal Incidents | Crime Rate (Per 100,000 Residents) | QLD Crime Rate (per 100,000 residents) |
|---|---|---|---|---|
| Drug Offences | 0 | 48217 | 0 | 935 |
| Trespassing and Vagrancy | 0 | 5680 | 0 | 110 |
| Liquor (excl. Drunkenness) | 0 | 2350 | 0 | 46 |
| Weapons Act Offences | 0 | 6258 | 0 | 121 |
| Traffic and Related Offences | 0 | 43253 | 0 | 839 |
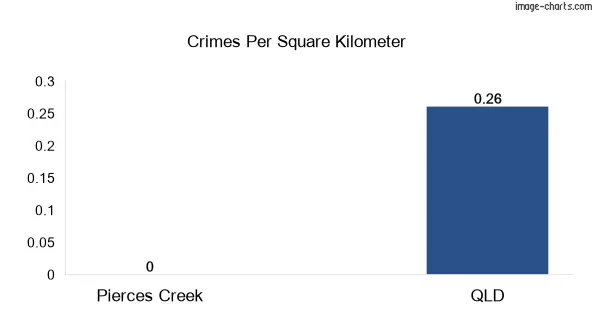
Pierces Creek Crimes per Square KM
How many murders were in Pierces Creek in 2022?
According to Queensland Police Service (QPS), there were 0 murders in Pierces Creek in 2022. The number of other homicides (which includes attempted murder, murder conspiracy, and manslaughter) was 0.
What’s the most common crime in Pierces Creek?
According to the latest available data from Queensland Police Service (QPS), the most common type of crime in Pierces Creek is unlawful use of motor vehicle.
What is the crime rate in Pierces Creek?
The overall crime rate in Pierces Creek, as measured by the number of reported offences per 100,000 population was 2105 in the year ending June 2022.
However, it’s important to note that this is an aggregate figure that includes all types of crime, and some types of offences are more prevalent than others. Additionally, crime rates can vary by location, with some areas experiencing higher rates of certain types of crime than others.
Is Pierces Creek a safe place to live in?
Pierces Creek is safer than 100% of suburbs across Australia and the crime rates are noticeably lower than the average compared to most Australia’s suburbs. Compared to Queensland suburbs, Pierces Creek is safer than 75% other suburbs in the state which are considered very high safety scores in Queensland.
Is Pierces Creek safe at night?
According to Queensland Government Statistician’s Office, 29% of crimes in Pierces Creek occur between 6 PM and 6 AM so, it’s fairly safe to walk alone in Pierces Creek at night.
Total Crime Stats of Pierces Creek
| Offence Divison | Offence Subdivison | Year (2021) | Year (2022) |
|---|---|---|---|
| Offences Against Property | Arson | 0 | 0 |
| Offences Against the Person | Assault | 0 | 0 |
| Offences Against the Person | Robbery | 0 | 0 |
| Offences Against the Person | Homicide (Murder) | 0 | 0 |
| Offences Against the Person | Other Homicide | 0 | 0 |
| Offences Against the Person | Other Offences Against the Person | 0 | 0 |
| Offences Against Property | Fraud | 0 | 0 |
| Offences Against Property | Unlawful Entry | 0 | 1 |
| Offences Against Property | Unlawful Use of Motor Vehicle | 0 | 1 |
| Offences Against Property | Handling Stolen Goods | 0 | 0 |
| Offences Against Property | Other Theft (excl. Unlawful Entry) | 0 | 0 |
| Offences Against Property | Other Property Damage | 0 | 0 |
| Other Offences | Drug Offences | 2 | 0 |
| Other Offences | Good Order Offences | 0 | 0 |
| Other Offences | Weapons Act Offences | 2 | 0 |
| Other Offences | Stock Related Offences | 0 | 0 |
| Other Offences | Traffic and Related Offences | 0 | 0 |
| Other Offences | Trespassing and Vagrancy | 0 | 0 |
| Other Offences | Prostitution Offences | 0 | 0 |
| Other Offences | Gaming Racing & Betting Offences | 0 | 0 |
| Other Offences | Liquor (excl. Drunkenness) | 0 | 0 |
| Other Offences | Miscellaneous Offences | 0 | 0 |
Note: This article doesn’t have detailed data for family violence, victims, female offenders, reoffending, sexual offences, stalking, and youth crime. For more information about these topics, check our resources page.
References
- Queensland Government Statistician’s Office
- Queensland Police Service (QPS)
Popular Suburbs Near Pierces Creek
Greater Capital City Statistical Area
State