Tullibigeal Crime Index
31
(100 is safest)
Safer than 31% of most Australia suburbs
Tullibigeal Crime Map
Tullibigeal Crime Statistics at a Glance
The chart below shows the 60-month trend of the number of offences that occurred in Tullibigeal.
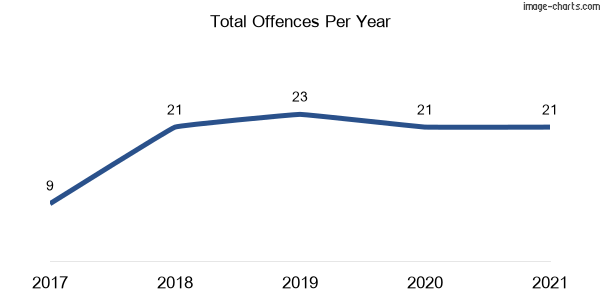
- There was no change in the number of criminal incidents recorded during the years 2020 and 2021.
- Tullibigeal is in the 28th percentile for safety, meaning 72% of NSW suburbs are safer than Tullibigeal and 28% of suburbs are more dangerous than Tullibigeal.
- The number of assault offences recorded in 2021 increased by 300% (3 Incidents) compared to the previous year..
- There was no change in the number of sexual offences recorded during the years 2020 and 2021.
- There were no homicide offences recorded during the years 2020 and 2021.
- There were no burglary offences recorded during the years 2020 and 2021.
- The number of theft offences recorded in 2021 decreased by 50% (3 Incidents) compared to the previous year.
- There were no robbery offences recorded during the years 2020 and 2021.
- There was no change in the number of motor vehicle theft offences recorded during the years 2020 and 2021.
- The number of vandalism offences (Property damage) recorded in 2021 decreased by 100% (9 Incidents) compared to the previous year.
Thinking of moving to Tullibigeal?
Experience the ease of moving with Muval, the ‘Uber for removals,’ backed by over 35,000 successful moves. Tap into Australia’s largest network of verified removalists nationwide. Compare prices & reviews, book, and move smoothly with Muval now!
Crime in Tullibigeal: An In-Depth Analysis
AU Crime Rate’s analysis of recent crime data from the NSW Bureau of Crime Statistics and Research (BOCSAR) reveals that Tullibigeal’s crime rate is quite a bit higher than average regarding to most Australian suburbs, as it is ranked safer than only 31% of suburbs across the country, irrespective of population size.
Approximately 72% of NSW suburbs have a lower crime rate compared to Tullibigeal. Therefore, Tullibigeal’s public safety metrics are moderate.
How risky is that? Living in Tullibigeal comes with a statistical risk of 1 in 23 of becoming a victim of crime, considering the total rate of crimes against the person and property. In contrast, the average chance of falling victim to crime in New South Wales stands at 1 in 20.
To better understand Tullibigeal’s overall crime rate, it is essential to examine its performance in crimes against the person and property crimes separately. This approach can provide further insight into whether violent crimes, property crimes, or both, are the primary drivers of the general crime rate in Tullibigeal.
AU Crime Rate’s analysis of Tullibigeal crime statistics shows that there are 3042 incidents against the person per 100,000 inhabitants in a standard year, compared to the NSW average rate of 1500. As a result, the chances of becoming a victim of crimes such as homicide, assault, sexual offences, robbery, abduction, kidnapping, stalking, blackmail, and extortion in Tullibigeal are 1 in 32.
Our analysis indicates that if you reside in Tullibigeal, your chances of falling victim to property crimes, including theft, burglary, arson, and malicious damage to property, are 1 in 87, equivalent to a rate of 1141 per 100,000 residents. As a reference, the property crime rate for every 100,000 residents in NSW is 3158.
Looking to understand the various types of criminal offences in New South Wales and make sense of crime data? Check out our NSW crime glossary for easy-to-understand definitions of common criminal offences.
Tullibigeal Crime Rates by Offences Division
Tullibigeal Crimes Against the Person
My Chances of Becoming a Victim of a Crime Against the Person
1 in 32
In Tullibigeal
1 in 65
In NSW
Crimes Against the Person Comparison (Per 100,000 Residents)
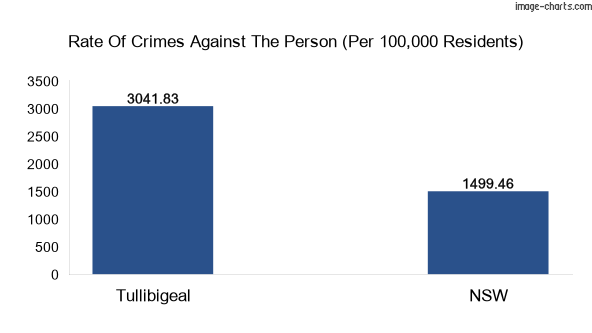
Crimes Against the Person: Tullibigeal vs NSW
Tullibigeal population: 263
NSW population: 8058541
Here is a breakdown of the major crimes against the person (violent crimes) including the number of offences and Tullibigeal crime rates for the selected offences.
Tullibigeal Property and Deception Offences
My Chances of Becoming a Victim of Property and Deception Offences
1 in 87
In Tullibigeal
1 in 30
In NSW
Property and Deception Offences Comparison (Per 100,000 Residents)
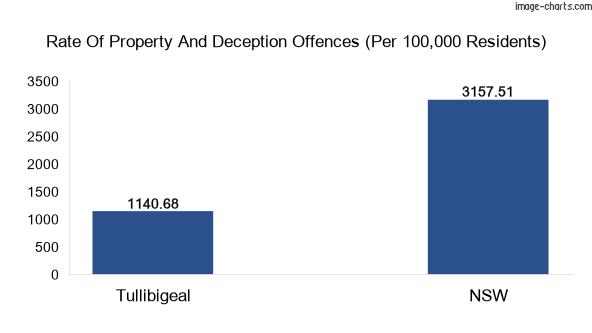
Property and Deception Offences: Tullibigeal vs NSW, Australia
Tullibigeal population: 263
NSW population: 8058541
An overview of the major property and deception offences, including Tullibigeal crime statistics for each offence type.
Drug Offences
Drug Offences Comparison (Per 100,000 Residents)
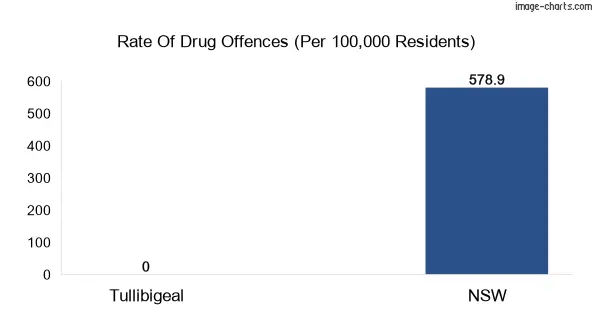
Drug Offences: Tullibigeal vs New South Wales
Public Order and Security Offences
Public Order and Security Offences Comparison (Per 100,000 Residents)
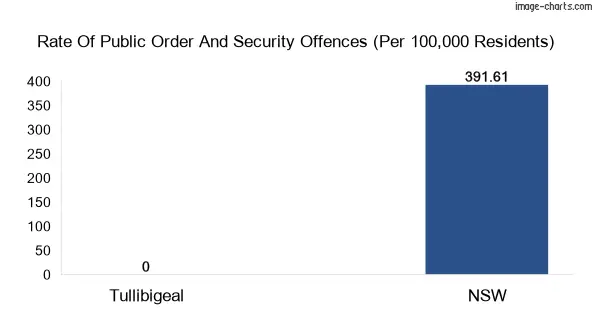
Public Order and Security Offences: Tullibigeal vs NSW
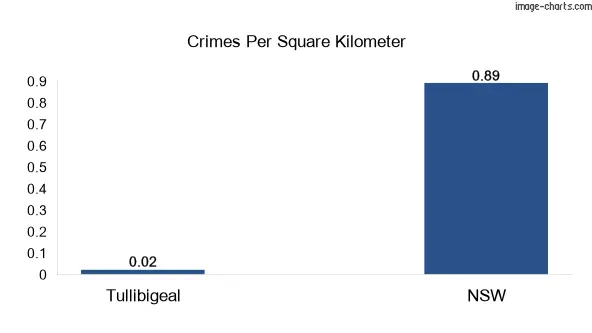
Tullibigeal Crimes per Square KM
Tullibigeal Crime FAQs
How many murders were in Tullibigeal in 2021?
According to the New South Wales Police Force and BOSCAR data, there were 0 murders in Tullibigeal in 2021. The number of homicides (which includes murders, attempted murder, murder conspiracy, and manslaughters) was 0.
What’s the most common crime in Tullibigeal?
According to the latest available data from the New South Wales Bureau of Crime Statistics and Research, the most common type of crime in Tullibigeal is liquor offences.
What is the crime rate in Tullibigeal?
The overall crime rate in Tullibigeal, as measured by the number of reported offences per 100,000 population was 7985 in the year ending December 2021.
However, it’s important to note that this is an aggregate figure that includes all types of crime, and some types of offences are more prevalent than others. Additionally, crime rates can vary by location, with some areas experiencing higher rates of certain types of crime than others.
Is Tullibigeal a safe place to live in?
NSW Bureau of Crime Statistics and Research (BOCSAR) states that Tullibigeal total crime rate in 2021 was 7985. This means it’s 28% safer than all NSW suburbs. So Tullibigeal has a moderate safety profile according to our scoring systems.
Is Tullibigeal safe at night?
50% of crimes in Tullibigeal occur between 6 PM and 6 AM so, it’s moderate safety to walk alone in Tullibigeal at night.
Total Crime Stats of Tullibigeal
Note: The data for murder and manslaughter refers to the number of recorded victims, not criminal incidents.
References
- NSW Police public site
- NSW Bureau of Crime Statistics and Research (BOCSAR).
- Australian Bureau of Statistics (ABS) Census QuickStats for all persons
Popular Suburbs in Tullibigeal
Greater Capital City Statistical Area
State