Claymore Crime Index
8
(100 is safest)
Safer than 8% of most Australia suburbs
Claymore Crime Map
Claymore Crime Statistics at a Glance
The chart below shows the 60-month trend of the number of offences that occurred in Claymore.
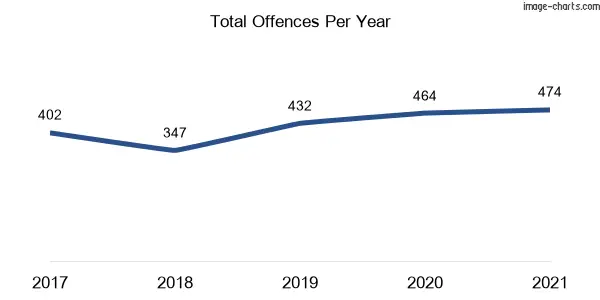
- The number of criminal incidents recorded by NSW Police in the year 2021 was 474, up 2% from 464 incidents recorded in the same period last year.
- Claymore is in the 8th percentile for safety, meaning 92% of NSW suburbs are safer than Claymore and 8% of suburbs are more dangerous than Claymore.
- The number of assault offences recorded in 2021 decreased by 16% (12 Incidents) compared to the previous year..
- The number of sexual offences recorded in 2021 decreased by 52% (12 Incidents) compared to the previous year.
- There were no homicide offences recorded during the years 2020 and 2021.
- The number of burglary offences recorded in 2021 decreased by 39% (13 Incidents) compared to the previous year.
- The number of theft offences recorded in 2021 increased by 16% (9 Incidents) compared to the previous year.
- The number of robbery offences recorded in 2021 increased by 200% (2 Incidents) compared to the previous year.
- The number of motor vehicle thefts recorded in 2021 increased by 29% (2 Incidents) compared to the previous year.
- The number of vandalism offences (Property damage) recorded in 2021 decreased by 25% (16 Incidents) compared to the previous year.
Thinking of moving to Claymore?
Experience the ease of moving with Muval, the ‘Uber for removals,’ backed by over 35,000 successful moves. Tap into Australia’s largest network of verified removalists nationwide. Compare prices & reviews, book, and move smoothly with Muval now!
Crime in Claymore: An In-Depth Analysis
According to AU Crime Rate’s analysis of the latest crime statistics from the NSW Bureau of Crime Statistics and Research, Claymore is ranked safer than 8% of the suburbs across Australia, regardless of population size. That means that Claymore crime rate is considerably higher than the average across most suburbs in Australia.
In NSW, only about 92% of suburbs have a lower crime rate than Claymore. As a result, Claymore has low scores in public safety metrics.
If you are a resident of Claymore, your chance of becoming a victim of crime is 1 in 9 (based on the total crime rate of crimes against the person and property combined) while the New South Wales average is 1 in 20.
Let’s take a closer look at Claymore’s crime statistics and see how it fares in terms of crimes against person and property crimes. This information is crucial because it can shed light on whether violent or property crimes or both, are the primary factors driving Claymore’s overall crime rate. So, are you curious to learn more about Claymore’s crime data and what they reveal about the suburb’s safety and security? Let’s dive in!
AU Crime Rate’s analysis reveals that against the person crime rate in Claymore is 4326 per one hundred thousand inhabitants while the NSW average rate is 1500. So, one’s chances of becoming a victim of crimes against the person in Claymore is 1 in 22. The crimes against the person included in this analysis are homicide, assault, sexual offences, robbery, abduction, kidnapping, stalking, blackmail, and extortion.
From our analysis, we discovered that your odds of becoming a victim of a property crime if you live in Claymore is 1 in 15. This is equal to a rate of 6196 per one hundred thousand residents compared to a rate of 3158 per 100,000 residents for NSW state. It’s worth mentioning that the property crimes tracked here include theft, burglary, arson, and malicious damage to property.
Looking to understand the various types of criminal offences in New South Wales and make sense of crime data? Check out our NSW crime glossary for easy-to-understand definitions of common criminal offences.
Claymore Crime Rates by Offences Division
| Division | Number of Crimes | Crime Rate (Per 100,000 Residents) |
|---|---|---|
| Crimes against the person | 111 | 4326 |
| Property and deception offences | 159 | 6196 |
| Drug offences | 48 | 1871 |
| Public order and security offences | 37 | 1442 |
| Justice procedures offences | 67 | 2611 |
| Other offences | 52 | 2027 |
| Total | 474 | 18472 |
Claymore Crimes Against the Person
My Chances of Becoming a Victim of a Crime Against the Person
1 in 22
In Claymore
1 in 65
In NSW
Crimes Against the Person Comparison (Per 100,000 Residents)
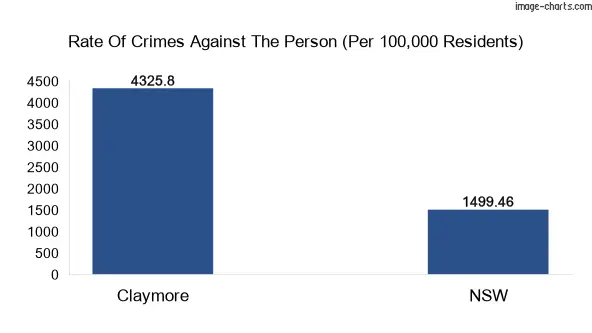
Crimes Against the Person: Claymore vs NSW
Claymore population: 2566
NSW population: 8058541
| Crimes | Total Criminal Incidents | NSW Total Criminal Incidents | Crime Rate (Per 100,000 Residents) | NSW Crime Rate (per 100,000 residents) |
|---|---|---|---|---|
| Homicide | 0 | 72 | 0 | 1 |
| Assault | 63 | 62864 | 2455 | 770 |
| Sexual offences | 11 | 14650 | 429 | 179 |
| Robbery | 3 | 1760 | 117 | 22 |
| Abduction and kidnapping | 1 | 203 | 39 | 3 |
| Blackmail and Extortion | 0 | 127 | 0 | 2 |
| Intimidation, stalking and harassment | 32 | 40910 | 1247 | 501 |
| Other offences against the person | 1 | 1883 | 39 | 23 |
Here is a breakdown of the major crimes against the person (violent crimes) including the number of offences and Claymore crime rates for the selected offences.
| Crimes | No. of offences | Rate |
|---|---|---|
| Murder | 0 | 0 |
| Sexual assault | 5 | 195 |
| Sexual touching, sexual act and other sexual offences | 6 | 234 |
| Domestic violence related assault | 36 | 1403 |
| Non-domestic violence related assault | 22 | 857 |
Claymore Property and Deception Offences
My Chances of Becoming a Victim of Property and Deception Offences
1 in 15
In Claymore
1 in 30
In NSW
Property and Deception Offences Comparison (Per 100,000 Residents)
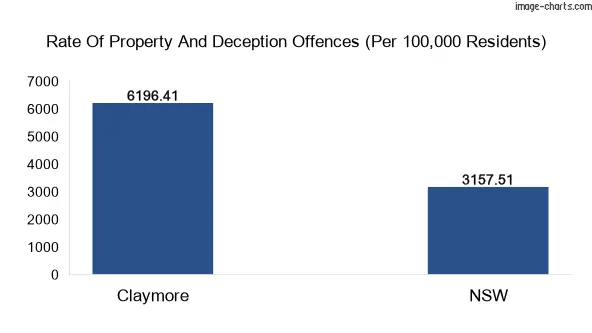
Property and Deception Offences: Claymore vs NSW, Australia
Claymore population: 2566
NSW population: 8058541
| Crimes | Total Criminal Incidents | NSW Total Criminal Incidents | Crime Rate (Per 100,000 Residents) | NSW Crime Rate (Per 100,000 Residents) |
|---|---|---|---|---|
| Theft | 67 | 180028 | 2611 | 2204 |
| Burglary/Break and Enter | 20 | 24967 | 779 | 306 |
| Arson | 25 | 3760 | 974 | 46 |
| Malicious damage to property | 47 | 49136 | 1832 | 602 |
An overview of the major property and deception offences, including Claymore crime statistics for each offence type.
| Crimes | No. of offences | Rate |
|---|---|---|
| Motor vehicle theft | 9 | 351 |
| Steal from motor vehicle | 11 | 429 |
| Steal from retail store | 0 | 0 |
| Break and enter dwelling | 18 | 701 |
| Break and enter non-dwelling | 2 | 78 |
Drug Offences
Drug Offences Comparison (Per 100,000 Residents)
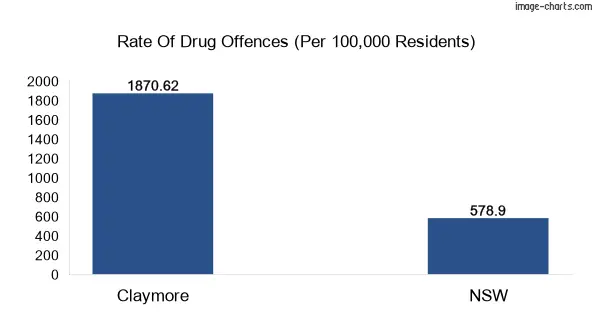
Drug Offences: Claymore vs New South Wales
| Crimes | Total Criminal Incidents | NSW Total Criminal Incidents | Crime Rate (Per 100,000 Residents) | NSW Crime Rate (Per 100,000 Residents) |
|---|---|---|---|---|
| Drug use and possession | 26 | 34032 | 1013 | 41667 |
| Drug dealing and trafficking | 17 | 6293 | 663 | 7705 |
| Cultivate or manufacture drugs | 0 | 1116 | 0 | 1366 |
| Other drug offences | 5 | 5841 | 195 | 72 |
Public Order and Security Offences
Public Order and Security Offences Comparison (Per 100,000 Residents)
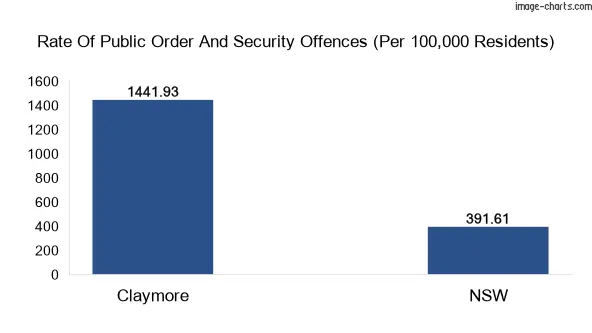
Public Order and Security Offences: Claymore vs NSW
| Crimes | Total Criminal Incidents | NSW Total Criminal Incidents | Crime Rate (Per 100,000 Residents) | NSW Crime Rate (Per 100,000 Residents) |
|---|---|---|---|---|
| Disorderly conduct | 19 | 17321 | 740 | 212.07 |
| Prohibited and regulated weapons offences | 18 | 14664 | 701 | 179.54 |
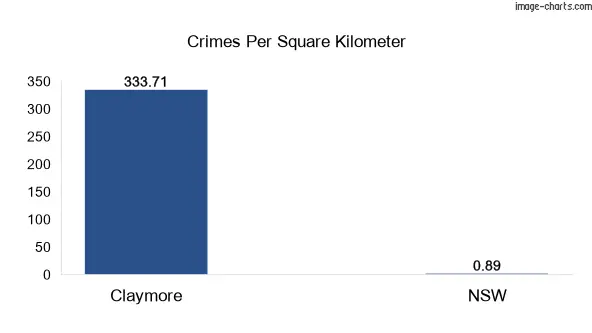
Claymore Crimes per Square KM
Claymore Crime FAQs
How many murders were in Claymore in 2021?
According to the New South Wales Police Force and BOSCAR data, there were 0 murders in Claymore in 2021. The number of homicides (which includes murders, attempted murder, murder conspiracy, and manslaughters) was 0.
What’s the most common crime in Claymore?
According to the latest available data from the New South Wales Bureau of Crime Statistics and Research, the most common type of crime in Claymore is malicious damage to property.
What is the crime rate in Claymore?
The overall crime rate in Claymore, as measured by the number of reported offences per 100,000 population was 18472 in the year ending December 2021.
However, it’s important to note that this is an aggregate figure that includes all types of crime, and some types of offences are more prevalent than others. Additionally, crime rates can vary by location, with some areas experiencing higher rates of certain types of crime than others.
Is Claymore a safe place to live in?
NSW Bureau of Crime Statistics and Research (BOCSAR) states that Claymore total crime rate in 2021 was 18472. This means it’s 8% safer than all NSW suburbs. So Claymore has a low safety profile according to our scoring systems.
Is Claymore safe at night?
28% of crimes in Claymore occur between 6 PM and 6 AM so, it’s fairly safe to walk alone in Claymore at night.
Total Crime Stats of Claymore
| Division | Subdivision | Offence type | Year (2020) | Year (2021) |
|---|---|---|---|---|
| Crimes against the person | Homicide | Murder | 0 | 0 |
| Crimes against the person | Homicide | Attempted murder | 0 | 0 |
| Crimes against the person | Homicide | Murder accessory, conspiracy | 0 | 0 |
| Crimes against the person | Homicide | Manslaughter | 0 | 0 |
| Crimes against the person | Assault | Assault Police | 2 | 5 |
| Crimes against the person | Assault | Domestic violence related assault | 41 | 36 |
| Crimes against the person | Assault | Non-domestic violence related assault | 32 | 22 |
| Crimes against the person | Sexual offencens | Sexual assault | 13 | 5 |
| Crimes against the person | Sexual offencens | Sexual touching, sexual act and other sexual offences | 10 | 13 |
| Crimes against the person | Robbery | Robbery | 12 | 6 |
| Crimes against the person | Abduction and kidnapping | Abduction and kidnapping | 0 | 1 |
| Crimes against the person | Blackmail and extortion | Blackmail and extortion | 0 | 0 |
| Crimes against the person | Intimidation, stalking and harassment | Intimidation, stalking and harassment | 47 | 32 |
| Crimes against the person | Other offences against the person | Other offences against the person | 3 | 1 |
| Property and deception offences | Theft | Motor vehicle theft | 7 | 9 |
| Property and deception offences | Theft | Steal from motor vehicle | 15 | 11 |
| Property and deception offences | Theft | Steal from retail store | 3 | 0 |
| Property and deception offences | Theft | Receiving or handling stolen goods | 4 | 9 |
| Property and deception offences | Theft | Steal from dwelling | 13 | 21 |
| Property and deception offences | Theft | Steal from person | 1 | 1 |
| Property and deception offences | Theft | Stock theft | 0 | 0 |
| Property and deception offences | Theft | Fraud | 12 | 13 |
| Property and deception offences | Theft | Other theft offences | 3 | 3 |
| Property and deception offences | Burglary/Break and enter | Break and enter dwelling | 33 | 18 |
| Property and deception offences | Burglary/Break and enter | Break and enter non-dwelling | 0 | 12 |
| Property and deception offences | Arson | Arson | 28 | 25 |
| Property and deception offences | Malicious damage to property | Malicious damage to property | 63 | 47 |
| Drug offences | Drug use and possession | Possession and/or use of cocaine | 1 | 2 |
| Drug offences | Drug use and possession | Possession and/or use of narcotics | 1 | 1 |
| Drug offences | Drug use and possession | Possession and/or use of cannabis | 5 | 10 |
| Drug offences | Drug use and possession | Possession and/or use of amphetamines | 6 | 8 |
| Drug offences | Drug use and possession | Possession and/or use of ecstasy | 1 | 0 |
| Drug offences | Drug use and possession | Possession and/or use of other drugs | 5 | 5 |
| Drug offences | Drug dealing and trafficking | Dealing, trafficking in cocaine | 0 | 0 |
| Drug offences | Drug dealing and trafficking | Dealing, trafficking in narcotics | 0 | 0 |
| Drug offences | Drug dealing and trafficking | Dealing, trafficking in cannabis | 14 | 1 |
| Drug offences | Drug dealing and trafficking | Dealing, trafficking in amphetamines | 2 | 16 |
| Drug offences | Drug dealing and trafficking | Dealing, trafficking in ecstasy | 8 | 0 |
| Drug offences | Drug dealing and trafficking | Dealing, trafficking in other drugs | 0 | 0 |
| Drug offences | Cultivate or manufacture drugs | Cultivating cannabis | 0 | 0 |
| Drug offences | Cultivate or manufacture drugs | Manufacture drug | 0 | 0 |
| Drug offences | Drug dealing and trafficking | Importing drugs | 0 | 0 |
| Drug offences | Other drug offences | Other drug offences | 0 | 5 |
| Public order and security offences | Disorderly conduct | Trespass | 7 | 8 |
| Public order and security offences | Disorderly conduct | Offensive conduct | 1 | 2 |
| Public order and security offences | Disorderly conduct | Offensive language | 1 | 5 |
| Public order and security offences | Disorderly conduct | Criminal intent | 5 | 4 |
| Public order and security offences | Prohibited and regulated weapons offences | Prohibited and regulated weapons offences | 4 | 18 |
| Other offences | Betting and gaming offences | Betting and gaming offences | 0 | 0 |
| Other offences | Liquor offences | Liquor offences | 0 | 0 |
| Other offences | Pornography offences | Pornography offences | 1 | 1 |
| Other offences | Prostitution offences | Prostitution offences | 0 | 0 |
| Other offences | Transport regulatory offences | Transport regulatory offences | 0 | 0 |
| Other offences | Miscellaneous offences | Miscellaneous offences | 10 | 51 |
| Justice procedures offences | Against justice procedures | Escape custody | 0 | 0 |
| Justice procedures offences | Against justice procedures | Breach Apprehended Violence Order | 26 | 24 |
| Justice procedures offences | Against justice procedures | Breach bail conditions | 24 | 32 |
| Justice procedures offences | Against justice procedures | Fail to appear | 0 | 0 |
| Justice procedures offences | Against justice procedures | Resist or hinder officer | 7 | 8 |
| Justice procedures offences | Against justice procedures | Other offences against justice procedures | 4 | 3 |
Note: The data for murder and manslaughter refers to the number of recorded victims, not criminal incidents.
References
- NSW Police public site
- NSW Bureau of Crime Statistics and Research (BOCSAR).
- Australian Bureau of Statistics (ABS) Census QuickStats for all persons
Popular Suburbs in Claymore
Greater Capital City Statistical Area
State