Sydney Crime Index
77
(100 is safest)
Safer than 77% of most Australia cities
Sydney Crime Map
Sydney Crime Statistics at a Glance
The chart illustrates the trend in the number of offences that happened in Sydney over the past 60 months.
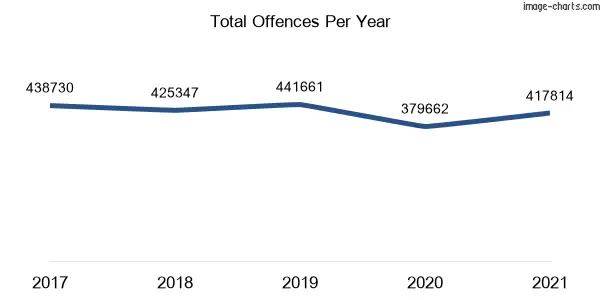
- In 2021, there was a 10% increase (38152 Incidents) in total criminal incidents compared to the previous year.
- Sydney is in the 48th percentile for safety, meaning 52% of NSW cities are safer and 48% of cities are more dangerous.
- The number of criminal incidents of assault decreased by 7% (2456 Incidents) from 2020 to 2021.
- The number of sexual offences recorded in 2021 (including sexual assault) decreased by 4% (279 Incidents) compared to the previous year.
- The number of homicide offences recorded in 2021 decreased by 49% (33 Incidents) compared to the previous year.
- The number of burglary offences (unlawful entry) recorded in 2021 decreased by 16% (2028 Incidents) compared to the previous year.
- The number of theft offences recorded in 2021 decreased by 9% (8260 Incidents) compared to the previous year.
- The number of motor vehicle thefts (car theft and others) recorded in 2021 decreased by 19% (1223 Incidents) compared to the previous year.
- The number of vandalism offences (Property damage) recorded in 2021 decreased by 13% (3530 Incidents) compared to the previous year.
Thinking of moving to Sydney?
Experience the ease of moving with Muval, the ‘Uber for removals,’ backed by over 35,000 successful moves. Tap into Australia’s largest network of verified removalists nationwide. Compare prices & reviews, book, and move smoothly with Muval now!
Crime in Sydney: An In-Depth Analysis
According to Safer Australia’s analysis of the latest crime statistics from the NSW Bureau of Crime Statistics and Research, Sydney is ranked safer than 77% of the cities and towns across Australia, regardless of population size. That means that Sydney crime rate is below average to all cities and towns in Australia. However, Sydney city is ranked as the 5th safest city in the world.
In NSW, only about 23% of communities have a lower crime rate than Sydney. As a result, Sydney has moderate scores in public safety metrics.
If you are a resident of Sydney, your chance of becoming a victim of crime is 1 in 27 (based on the total crime rate of crimes against the person and property combined) while the New South Wales average is 1 in 20.
Let’s take a closer look at Sydney’s crime statistics and see how it fares in terms of crimes against person and property crimes. This information is crucial because it can shed light on whether violent crimes or property crimes or both, are the primary factors driving Sydney’s overall crime rate. So, are you curious to learn more about Sydney’s crime data and what they reveal about the community’s safety and security? Let’s dive in!
Safer Australia’s analysis reveals that against the person crime rate in Sydney is 1249 per one hundred thousand inhabitants while the NSW average rate is 1500. So, one’s chances to become a victim of crimes against the person in Sydney is 1 in 79. The crimes against the person included in this analysis are homicide, assault, sexual offences (sexual assault and other sexual offences combined), robbery (including armed robberies), abduction, kidnapping, stalking, blackmail, and extortion.
From our analysis, we discovered that your odds of becoming a victim of a property crime if you live in Sydney is 1 in 42. This is equal to a rate of 2331 per one hundred thousand residents compared to a rate of 3158 per 100,000 residents for NSW state. It’s worth mentioning that the property crimes tracked here include theft, burglary (unlawful entry), arson, and malicious damage to property.
Discovering the intricacies of criminal offences in New South Wales and interpreting crime data can be a daunting task. However, fear not! Our NSW crime glossary provides clear and concise definitions of the most common criminal offences, making it easier for you to comprehend the information.
Sydney Crime Rates by Offences Division
| Division | Number of Crimes | Crime Rate (Per 100,000 Residents) |
|---|---|---|
| Crimes against the person | 65308 | 1500 |
| Property and deception offences | 121917 | 2331 |
| Drug offences | 30554 | 584 |
| Public order and security offences | 16050 | 307 |
| Justice procedures offences | 45406 | 868 |
| Other offences | 138579 | 2650 |
| Total | 417814 | 7989 |
Sydney Crimes Against the Person
My Chances of Becoming a Victim of a Crime Against the Person
1 in 79
In Sydney
1 in 65
In NSW
Crimes Against the Person Comparison (Per 100,000 Residents)
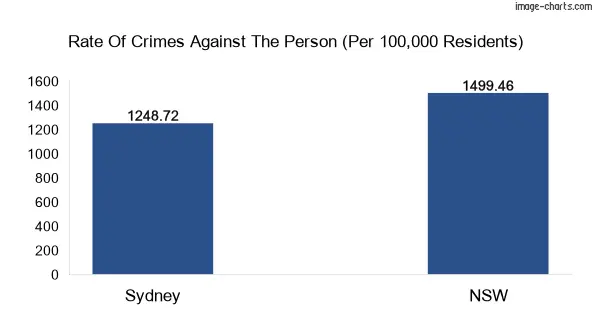
Crimes Against the Person: Sydney vs NSW
Sydney population: 5230011
NSW population: 8058541
| Crimes | Total Criminal Incidents | NSW Total Criminal Incidents | Crime Rate (Per 100,000 Residents) | NSW Crime Rate (per 100,000 residents) |
|---|---|---|---|---|
| Homicide | 35 | 72 | 1 | 1 |
| Assault | 33623 | 62864 | 643 | 770 |
| Sexual offences | 7320 | 14650 | 140 | 179 |
| Robbery | 1115 | 1760 | 21 | 22 |
| Abduction and kidnapping | 125 | 203 | 2 | 3 |
| Blackmail and Extortion | 104 | 127 | 2 | 2 |
| Intimidation, stalking and harassment | 21943 | 40910 | 420 | 501 |
| Other offences against the person | 1043 | 1883 | 20 | 23 |
Please find below a detailed breakdown of the major crimes against the person, including the number of offences and corresponding Sydney crime rates for the selected offences.
| Crimes | No. of offences | Rate |
|---|---|---|
| Murder | 23 | 0.44 |
| Sexual assault | 3487 | 67 |
| Sexual touching, sexual act and other sexual offences | 3833 | 73 |
| Domestic violence related assault | 17412 | 333 |
| Non-domestic violence related assault | 14686 | 280 |
Sydney Property and Deception Offences
My Chances of Becoming a Victim of Property and Deception Offences
1 in 42
In Sydney
1 in 30
In NSW
Property and Deception Offences Comparison (Per 100,000 Residents)
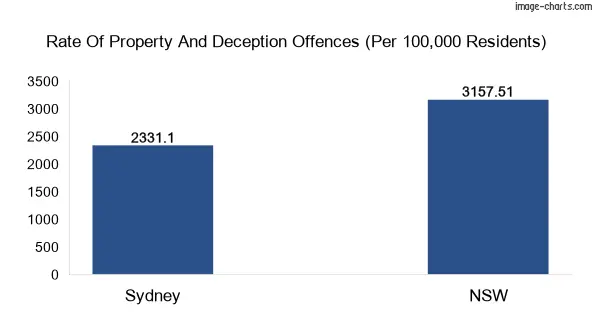
Property and Deception Offences: Sydney vs NSW, Australia
Sydney population: 5230011
NSW population: 8058541
| Crimes | Total Criminal Incidents | NSW Total Criminal Incidents | Crime Rate (Per 100,000 Residents) | NSW Crime Rate (Per 100,000 Residents) |
|---|---|---|---|---|
| Theft | 85784 | 180028 | 1640 | 2204 |
| Burglary/Break and Enter | 10549 | 24967 | 202 | 306 |
| Arson | 1322 | 3760 | 25 | 46 |
| Malicious damage to property | 24262 | 49136 | 464 | 602 |
The following are the major property and deception offences, along with Sydney crime statistics for each type of offence.
| Crimes | No. of offences | Rate |
|---|---|---|
| Motor vehicle theft | 5049 | 97 |
| Steal from motor vehicle | 14737 | 282 |
| Steal from retail store | 11298 | 216 |
| Break and enter dwelling | 7978 | 153 |
| Break and enter non-dwelling | 2571 | 49 |
Drug Offences
Drug Offences Comparison (Per 100,000 Residents)
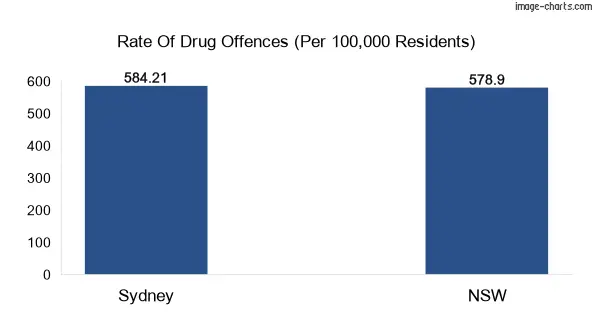
Drug Offences: Sydney vs New South Wales
| Crimes | Total Criminal Incidents | NSW Total Criminal Incidents | Crime Rate (Per 100,000 Residents) | NSW Crime Rate (Per 100,000 Residents) |
|---|---|---|---|---|
| Drug use and possession | 22178 | 34032 | 424 | 41667 |
| Drug dealing and trafficking | 4071 | 6293 | 78 | 7705 |
| Cultivate or manufacture drugs | 463 | 1116 | 9 | 1366 |
| Other drug offences | 3842 | 5841 | 37 | 72 |
Public Order and Security Offences
Public Order and Security Offences Comparison (Per 100,000 Residents)
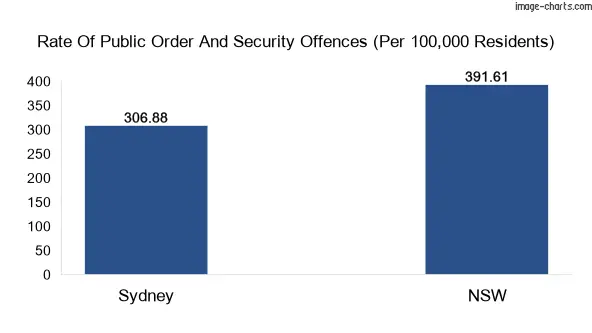
Public Order and Security Offences: Sydney vs NSW
| Crimes | Total Criminal Incidents | NSW Total Criminal Incidents | Crime Rate (Per 100,000 Residents) | NSW Crime Rate (Per 100,000 Residents) |
|---|---|---|---|---|
| Disorderly conduct | 8579 | 17321 | 164 | 212 |
| Prohibited and regulated weapons offences | 7471 | 14664 | 143 | 180 |
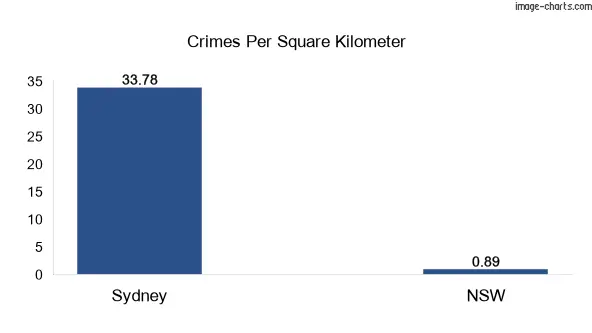
Sydney Crimes per Square KM
Sydney Crime FAQs
How many murders were in Sydney in 2021?
According to the New South Wales Police Force and BOSCAR data, there were 23 murders in Sydney in 2021. The number of homicides (which includes murders, attempted murder, murder conspiracy, and manslaughters) was 35 with a homicide rate of 1 in 100,000 persons.
What’s the most common crime in Sydney?
According to the latest available data from the New South Wales Bureau of Crime Statistics and Research, the most common type of crime in Sydney is Breach bail conditions.
What is the crime rate in Sydney?
The overall crime rate in Sydney, as measured by the number of reported offences per 100,000 population was 7989 offences per 100,000 population in the year ending December 2021.
However, it’s important to note that this is an aggregate figure that includes all types of crime, and some types of offences are more prevalent than others. Additionally, crime rates can vary by location, with some areas experiencing higher rates of certain types of crime than others.
Is Sydney a safe place to live in?
NSW Bureau of Crime Statistics and Research (BOCSAR) states that Sydney total crime rate in 2021 was 7989. This means it’s 49% safer than all NSW suburbs. So Sydney has a moderate safety profile according to our scoring systems.
Is Sydney safe at night?
36% of crimes in Sydney occur between 6 PM and 6 AM so, it’s fairly safe to walk alone in Sydney at night.
What suburb has the highest crime rate in Sydney?
Haymarket is the suburb with the highest rate of reported criminal incidents in Sydney with a rate of 116803 incidents per 100,000 population, according to BOCSAR’s 2021 data. Yet, Haymarket is safer than 1% of NSW suburbs.
What is the safest suburb in Sydney?
Green Point (Gosford) is the safest suburb in Sydney with a rate of 15 incidents per 100,000 population as per BOCSAR’s 2021 report. Green Point (Gosford) is safer than 100% of NSW suburbs making it one of the suburbs with the lowest crime rates.
However, it’s important to note that low crime rates do not necessarily guarantee safety, and that crime can occur anywhere, so it’s important to always stay vigilant and take appropriate safety measures.
Sydney Crime Rate by Suburb
| Sydney suburbs | Total crimes in 2020 | Total crime rate in 2020 | Total crimes in 2021 | Total crime rate in 2021 |
|---|---|---|---|---|
| Abbotsbury | 104 | 2473 | 105 | 2497 |
| Abbotsford | 141 | 2587 | 150 | 2752 |
| Acacia Gardens | 76 | 2066 | 112 | 3045 |
| Agnes Banks | 43 | 4348 | 42 | 4247 |
| Airds | 421 | 12910 | 427 | 13094 |
| Alexandria | 909 | 9412 | 970 | 10043 |
| Alfords Point | 79 | 2519 | 67 | 2136 |
| Alison (Central Coast) | 6 | 7059 | 9 | 10588 |
| Allambie Heights | 153 | 2087 | 153 | 2087 |
| Allawah | 122 | 2267 | 112 | 2081 |
| Ambarvale | 534 | 7351 | 745 | 10256 |
| Annandale | 362 | 3817 | 479 | 5051 |
| Annangrove | 53 | 3618 | 34 | 2321 |
| Appin | 95 | 2950 | 108 | 3354 |
| Arcadia | 33 | 2230 | 33 | 2230 |
| Arncliffe | 566 | 4706 | 765 | 6361 |
| Arndell Park | 124 | 2066667 | 101 | 1683333 |
| Artarmon | 441 | 4677 | 415 | 4401 |
| Ashbury | 50 | 1490 | 47 | 1400 |
| Ashcroft | 761 | 20941 | 424 | 11668 |
| Ashfield | 1392 | 6048 | 1500 | 6517 |
| Asquith | 185 | 3008 | 203 | 3301 |
| Auburn | 2490 | 6334 | 3344 | 8507 |
| Austral | 255 | 3737 | 284 | 4162 |
| Avalon Beach | 256 | 2473 | 252 | 2435 |
| Avoca Beach | 154 | 3282 | 142 | 3026 |
| Badgerys Creek | 31 | 17614 | 23 | 13068 |
| Balgowlah | 270 | 3323 | 209 | 2572 |
| Balgowlah Heights | 62 | 1755 | 52 | 1472 |
| Balmain | 512 | 4897 | 615 | 5882 |
| Balmain East | 88 | 4676 | 94 | 4995 |
| Bangor | 130 | 2347 | 100 | 1806 |
| Banksia | 158 | 4819 | 178 | 5428 |
| Banksmeadow | 78 | 15663 | 75 | 15060 |
| Bankstown | 6072 | 17363 | 6417 | 18350 |
| Bankstown Aerodrome | 64 | 1280000 | 79 | 1580000 |
| Bar Point | 18 | 15000 | 19 | 15833 |
| Barangaroo | 85 | 38462 | 183 | 82805 |
| Barden Ridge | 109 | 2633 | 140 | 3382 |
| Bardia | 203 | 3534 | 196 | 3412 |
| Bardwell Park | 78 | 3351 | 58 | 2491 |
| Bardwell Valley | 45 | 1934 | 34 | 1461 |
| Bargo | 184 | 4050 | 216 | 4755 |
| Bass Hill | 962 | 9424 | 1025 | 10041 |
| Bateau Bay | 813 | 6480 | 901 | 7182 |
| Baulkham Hills | 1072 | 2868 | 1160 | 3103 |
| Bayview | 91 | 2393 | 83 | 2183 |
| Beacon Hill | 165 | 2111 | 175 | 2239 |
| Beaconsfield | 22 | 1890 | 34 | 2921 |
| Beaumont Hills | 178 | 1967 | 155 | 1713 |
| Beecroft | 191 | 1852 | 219 | 2123 |
| Belfield | 231 | 3525 | 202 | 3082 |
| Belimbla Park | 5 | 865 | 18 | 3114 |
| Bell | 3 | 7143 | 15 | 35714 |
| Bella Vista | 303 | 3621 | 317 | 3788 |
| Bellevue Hill | 269 | 2541 | 265 | 2503 |
| Belmore | 624 | 4521 | 649 | 4702 |
| Belrose | 275 | 3146 | 226 | 2585 |
| Bensville | 57 | 2278 | 51 | 2038 |
| Berala | 261 | 2981 | 237 | 2707 |
| Berambing | 2 | 1980 | 1 | 990 |
| Berkeley Vale | 343 | 3838 | 320 | 3581 |
| Berkshire Park | 61 | 2827 | 77 | 3568 |
| Berowra | 265 | 5567 | 259 | 5441 |
| Berowra Heights | 122 | 2318 | 101 | 1919 |
| Berowra Waters | 15 | 9259 | 6 | 3704 |
| Berrilee | 7 | 3226 | 8 | 3687 |
| Beverley Park | 55 | 2082 | 72 | 2725 |
| Beverly Hills | 397 | 3800 | 501 | 4796 |
| Bexley | 571 | 2906 | 627 | 3191 |
| Bexley North | 151 | 3526 | 153 | 3572 |
| Bidwill | 713 | 16972 | 804 | 19138 |
| Bilgola Beach | 7 | 2823 | 4 | 1613 |
| Bilgola Plateau | 76 | 2076 | 71 | 1939 |
| Bilpin | 21 | 3201 | 24 | 3659 |
| Birchgrove | 105 | 3277 | 71 | 2216 |
| Birrong | 203 | 6071 | 208 | 6220 |
| Blackett | 536 | 14955 | 561 | 15653 |
| Blackheath | 236 | 5061 | 202 | 4332 |
| Blacktown | 11707 | 22987 | 15102 | 29653 |
| Blackwall | 121 | 6234 | 72 | 3709 |
| Blair Athol | 56 | 2057 | 52 | 1910 |
| Blairmount | 27 | 6683 | 19 | 4703 |
| Blakehurst | 228 | 3428 | 257 | 3863 |
| Blaxland | 314 | 4217 | 379 | 5090 |
| Blaxlands Ridge | 15 | 2568 | 55 | 9418 |
| Bligh Park | 237 | 3793 | 205 | 3281 |
| Blue Bay | 55 | 5179 | 166 | 15631 |
| Blue Haven | 445 | 6781 | 381 | 5806 |
| Blue Mountains National Park | 66 | 0 | 88 | 0 |
| Bondi | 708 | 6820 | 652 | 6281 |
| Bondi Beach | 1437 | 12437 | 1846 | 15977 |
| Bondi Junction | 2041 | 19708 | 1752 | 16918 |
| Bonnet Bay | 26 | 1159 | 29 | 1292 |
| Bonnyrigg | 540 | 5536 | 630 | 6458 |
| Bonnyrigg Heights | 168 | 2281 | 218 | 2960 |
| Booker Bay | 48 | 3333 | 77 | 5347 |
| Bossley Park | 413 | 2672 | 431 | 2789 |
| Botany | 487 | 3765 | 415 | 3208 |
| Bouddi | 4 | 100000 | 5 | 125000 |
Note: The data for murder and manslaughter refers to the number of recorded victims, not criminal incidents.
References
- NSW Police public site
- NSW Bureau of Crime Statistics and Research (BOCSAR).
- Australian Bureau of Statistics (ABS) Census QuickStats for all persons
Popular Suburbs in Sydney
Popular Urban Areas Near Sydney
State