According to ACT Policing, Lyneham crime rate for the year ending December 2021 was 9898 incidents per 100,000 population. This represents a 21% decrease from the previous year.
Lyneham Crime Index
25
(100 is safest)
Safer than 25% of most Australia suburbs
Lyneham Crime Map
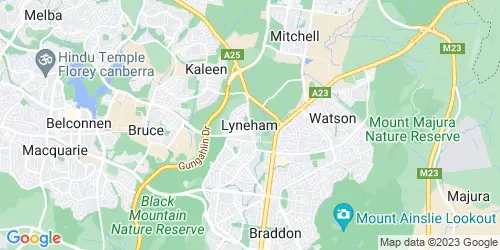
Is Lyneham Safe?
Lyneham has moderate safety safety metrics. Crime rates in Lyneham are quite a bit higher than average regarding to most Australian suburbs. Lyneham is safer than 25% of all Australian suburbs and than 27% of Australian Capital Territory (ACT) suburbs. However, theft (excluding motor vehicles) is a common offence in Lyneham.
Lyneham Crime Statistics at a Glance
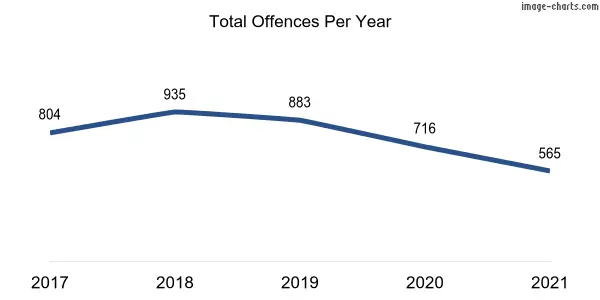
Has crime in Lyneham increased or decreased in the past 5 years? The chart below shows the 60-month historical trend of the number of offences that occurred in Lyneham.
- District: Inner North.
- The number of criminal incidents recorded by ACT Policing in the year 2021 was 565, down 21% from 716 incidents recorded in the same period last year.
- Lyneham is in the 27th percentile for safety, meaning 74% of ACT suburbs are safer than Lyneham and 27% of suburbs are more dangerous than Lyneham.
- Common crime: theft (excluding motor vehicles).
- The number of assault offences recorded in 2021 decreased by 11% (4 Incidents) compared to the previous year..
- The number of sexual offences recorded in 2021 increased by 133% (4 Incidents) compared to the previous year.
- There were no homicide offences recorded during the years 2020 and 2021.
- The number of burglary offences recorded in 2021 decreased by 25% (13 Incidents) compared to the previous year.
- The number of theft offences recorded in 2021 increased by 12% (16 Incidents) compared to the previous year.
- The number of robbery offences recorded in 2021 decreased by 75% (3 Incidents) compared to the previous year.
- The number of motor vehicle thefts recorded in 2021 increased by 57% (8 Incidents) compared to the previous year.
- The number of property damage offences recorded in 2021 decreased by 13% (11 Incidents) compared to the previous year.
Thinking of moving to Lyneham?
Experience the ease of moving with Muval, the ‘Uber for removals,’ backed by over 35,000 successful moves. Tap into Australia’s largest network of verified removalists nationwide. Compare prices & reviews, book, and move smoothly with Muval now!
Crime in Lyneham: An In-Depth Analysis
AU Crime Rate analyzed crime data from the ACT Policing and found that crime rates in Lyneham are quite a bit higher than average regarding to most Australian suburbs. In fact, it is considered safer than about 25% of suburbs in the country across all population sizes.
The crime rates in Lyneham are higher than approximately 74% of other suburbs in ACT. Consequently, the suburb has moderate safety scores for public safety.
Your chance of becoming a victim of a crime if you live here? It’s 1 in 16 based on the combined crime rate of offences against the person and property while the risk of becoming a victim of crime in ACT is at 1 in 23.
Discovering the full picture of Lyneham’s crime statistics is crucial, and delving into the details of its against the person and property crime data is the key. By doing so, we can uncover which type of crime is more prevalent, whether it be violent or property-related, and gain a deeper understanding of the crime rate in Lyneham. So join us on this exploration, as we uncover the nature and extent of crime in this community.
Lyneham crime rate for crimes against the person is 806 per 100,000 inhabitants, whereas the ACT average rate is 841. This meant that the likelihood of becoming a victim of such crimes in Lyneham was 1 in 123. The crimes against persons included in this analysis are homicide, assault, sexual offences, robbery, and other offences against the person.
According to our data, the likelihood of an individual becoming a victim of property crime in Lyneham is 1 in 19, with a rate of 5011 incidents per 100,000 inhabitants. It is important to note that the average rate of property crime in ACT is 3338 incidents per 100,000 residents. The property crimes included in this analysis consist of theft, motor vehicle theft, burglary, and property damage.
Lyneham Crime Rates by Offences Division
| Division | Number of Crimes | Crime Rate (Per 100,000 Residents) |
|---|---|---|
| Offences against the person | 46 | 806 |
| Offences against Property | 286 | 5011 |
| Other Offences | 233 | 4082 |
| Total | 565 | 9898 |
Lyneham Crimes Against the Person
These are violent crimes against people whether these are family violence or non-family violence. Basically, if someone does something to hurt or scare another person, it’s considered a crime against the person. This includes:
- Assault: According to ACT Policing, assault is an action aimed at inflicting non-lethal harm or injury to another individual, without any sexual or materialistic motives, and excluding attempts at murder or acts leading to death.
- Robbery: Robbery involves illegally seizing someone’s property with the intention to permanently keep it, taken directly from the person’s possession, control, or custody, often involving or threatening immediate physical force or violence.
- Homicide refers to the illegal act of killing or attempting to kill another person or conspiring to do so. This encompasses murder, attempted murder, and manslaughter resulting in death.
- Sexual assault is defined as any physical contact or attempted contact of a sexual nature towards another individual without their consent, or where consent is obtained through intimidation or deception. It also applies when consent is legally invalid due to factors like the individual’s age, mental incapacity (temporary or permanent), or a familial relationship.
- “Other offences against the person” encompass acts aimed at threatening or harassing an individual, or unlawfully restricting their freedom of movement against their will or the will of their legal guardian or caretaker. This category includes crimes such as abduction and kidnapping, false imprisonment or deprivation of liberty, and various forms of harassment and threatening behaviour.
My Chances of Becoming a Victim of a Crime Against the Person
1 in 123
In Lyneham
1 in 118
In ACT
Crimes Against the Person Comparison (Per 100,000 Residents)
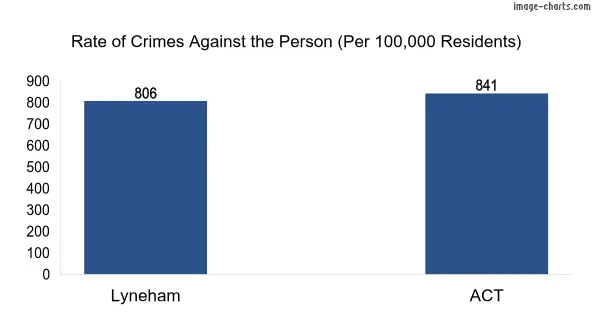
Crimes Against the Person: Lyneham vs ACT
Lyneham population: 5708
ACT population: 453764
| Crimes | Total Criminal Incidents | ACT Total Criminal Incidents | Crime Rate (Per 100,000 Residents) | ACT Crime Rate (per 100,000 residents) |
|---|---|---|---|---|
| Homicide | 0 | 15 | 0 | 3 |
| Assault | 34 | 2822 | 596 | 622 |
| Sexual offences | 7 | 537 | 123 | 118 |
| Robbery | 1 | 172 | 18 | 38 |
| Other offences against the person | 4 | 270 | 70 | 60 |
Lyneham Against Property offences
These are crimes related to stealing or damaging property or deceiving someone for personal gain. Property crimes include:
- Theft (excluding Motor Vehicles): Theft, excluding the stealing of motor vehicles, is the illegal act of taking or acquiring money, goods, services, or non-motorized vehicles without employing force, threat of force, violence, coercion, or deception. The intent behind this act is to permanently deprive the owner or possessor of the use of their money, goods, or services.
- Burglary (unlawful entry): Burglary is defined as the illegal entry into a structure, whether by force or not, with the intention to commit a crime. A structure in this context is any building enclosed by walls and capable of being secured, such as a house, flat, caravan, office, bank, shop, factory, school, or church.
- Stolen motor vehicles: The theft of motor vehicles involves illegally taking another person’s motor vehicle without authorization, intending to deprive the owner or possessor of its use, either temporarily or permanently. This category covers both the illegal use of a motor vehicle and the theft of a motor vehicle.
- Property damage: This refers to intentional or accidental harm caused to someone else’s property, such as vandalism, fire or explosion, and graffiti.
My Chances of Becoming a Victim of Against Property offences
1 in 19
In Lyneham
1 in 29
In ACT
Crimes Against Property Comparison (Per 100,000 Residents)
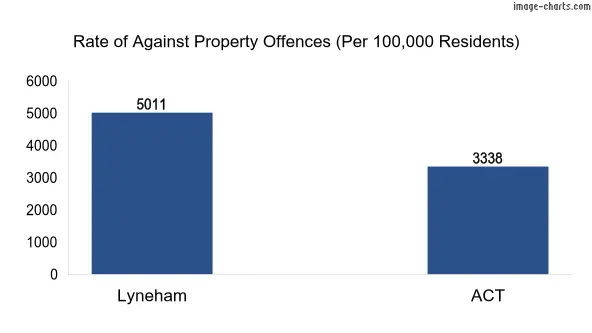
Against Property offences: Lyneham vs ACT
Lyneham population: 5708
ACT population: 453764
| Crimes | Total Criminal Incidents | ACT Total Criminal Incidents | Crime Rate (Per 100,000 Residents) | ACT Crime Rate (per 100,000 residents) |
|---|---|---|---|---|
| Theft (excluding Motor Vehicles) | 0 | 7919 | 0 | 1745 |
| Motor vehicle theft | 34 | 1425 | 596 | 314 |
| Burglary/Break and enter | 7 | 1986 | 123 | 438 |
| Property damage | 1 | 3817 | 18 | 841 |
Other Offences
“Other offences” encompass a wide range of criminal acts not covered under specific categories. This includes but is not limited to, offences related to deception, environmental crimes, weapons violations, drug offences, public order breaches, and driving-related offences.
Other Offences: Lyneham vs ACT
| Crimes | Total Criminal Incidents | ACT Total Criminal Incidents | Crime Rate (Per 100,000 Residents) | ACT Crime Rate (per 100,000 residents) |
|---|---|---|---|---|
| MISC. offences | 133 | 10223 | 2330 | 2253 |
| Traffic offences | 99 | 6280 | 1734 | 1384 |
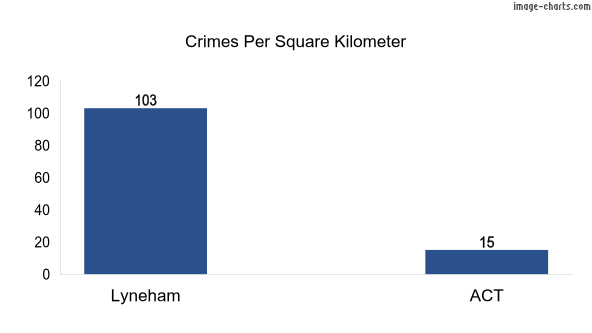
Lyneham Crimes per Square KM
How many murders in Lyneham in 2021?
According to ACT Policing, there were 0 homicides in Lyneham in 2021. It’s important to note that this figure includes all homicides, not just murders.
What’s the most common crime in Lyneham?
According to the latest available data from ACT Policing, the most common type of crime in Lyneham is theft (excluding motor vehicles).
What is the crime rate in Lyneham?
The overall crime rate in Lyneham, as measured by the number of reported offences per 100,000 population was 9898 in the year ending December 2021.
However, it’s important to note that this is an aggregate figure that includes all types of crime, and some types of offences are more prevalent than others. Additionally, crime rates can vary by location, with some areas experiencing higher rates of certain types of crime than others.
Is Lyneham a safe place to live in?
Lyneham is safer than 25% of suburbs across Australia and the crime rates are quite a bit higher than average regarding to most Australian suburbs. Compared to ACT suburbs, Lyneham is safer than 27% of other suburbs in the state which are considered moderate safety safety scores in ACT.
Total Crime Stats of Lyneham
| Subdivision | Offence type | Year (2020) | Year (2021) |
|---|---|---|---|
| Homicide | Homicide | 0 | 0 |
| Assault | Assault - FV | 14 | 11 |
| Assault | Assault - Non-FV | 24 | 23 |
| Sexual offences | Sexual offences | 3 | 7 |
| Robbery | Robbery - armed | 2 | 1 |
| Robbery | Robbery - other | 2 | 0 |
| Other offences against the person | Other offences against the person | 1 | 4 |
| Theft (excluding Motor Vehicles) | Theft (excluding Motor Vehicles) | 139 | 155 |
| Motor vehicle theft | Motor vehicle theft | 14 | 22 |
| Burglary | Burglary dwellings | 29 | 26 |
| Burglary | Burglary shops | 8 | 4 |
| Burglary | Burglary other | 14 | 8 |
| Property damage | Property damage | 82 | 71 |
| MISC. offences | MISC. offences | 209 | 133 |
| Traffic offences | Traffic Speeding | 30 | 13 |
| Traffic offences | Traffic Mobile Use | 18 | 15 |
| Traffic offences | Traffic Seatbelts | 2 | 0 |
| Traffic offences | Traffic Other | 125 | 71 |
Note: This article doesn’t have detailed data for family violence, victims, female offenders, reoffending, stalking, and youth crime. For more information about these topics, check our resources page. check our resources page.
References
- ACT Policing
- Australian Bureau of Statistics (ABS) Census QuickStats for all persons
Popular Suburbs Near Lyneham
Popular Urban Areas Near Lyneham